Everything I am doing is on a path to take as much off the SD card as logical and possible so that on the day the SD card does die I can just swap it out for a cloned SD card and it can pick up where it left off. Once I have it working like that I will share the solution in its entirety so it could just work with a simple home NHS setup for the average person.
(unless this is pointless - does hosting your own emoncms server store a copy of the data on the server in mysql or something? so if the SD card dies it can just be set up again and then pick up where it left off?)
Logs, from what I can see, are now being replicated from RAM onto a file share so I won’t need to worry about loss of logs again.
(1) pipafina 10s fixed interval is what all feeds are on. All feeds are the standard supped interfaces for the equipment supplied for solar. 2CT leads, Voltage meter, LED counter.
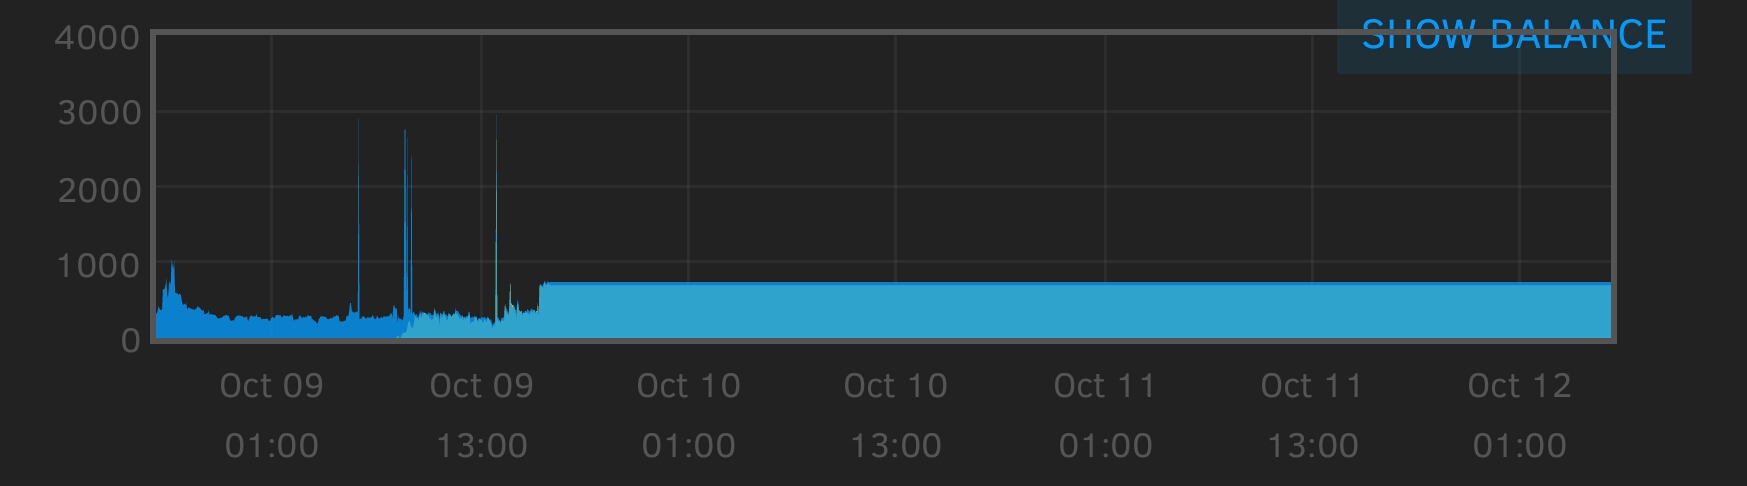
(3) it looks like the feeds stopped logging to the local sd card.
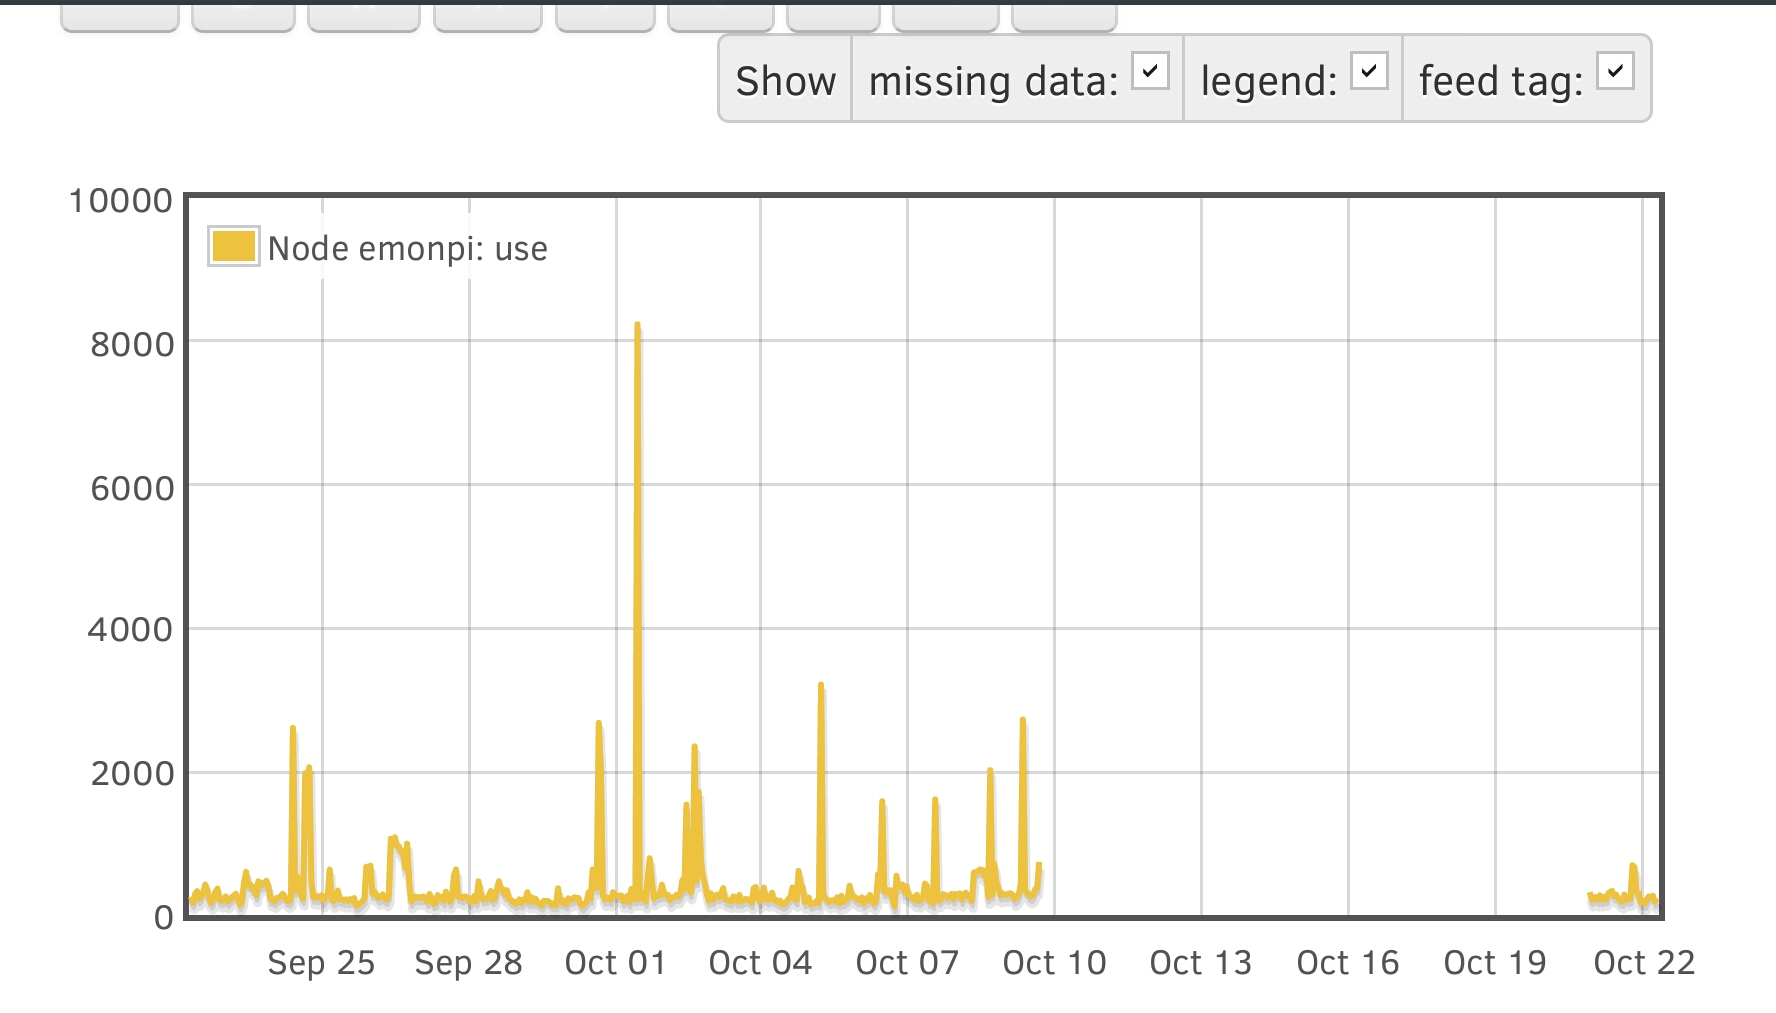
MONTH VIEW OF USE FEED:
1506063600, 203.0
1506067200, 212.0
1506070800, 174.0
1506074400, 293.0
1506078000, 332.0
1506081600, 222.0
1506085200, 271.0
1506088800, 322.0
1506092400, 424.0
1506096000, 347.0
1506099600, 205.0
1506103200, 170.0
1506106800, 240.0
1506110400, 326.0
1506114000, 368.0
1506117600, 213.0
1506121200, 197.0
1506124800, 218.0
1506128400, 258.0
1506132000, 188.0
1506135600, 229.0
1506139200, 242.0
1506142800, 271.0
1506146400, 295.0
1506150000, 225.0
1506153600, 143.0
1506157200, 208.0
1506160800, 455.0
1506164400, 602.0
1506168000, 423.0
1506171600, 428.0
1506175200, 368.0
1506178800, 391.0
1506182400, 275.0
1506186000, 470.0
1506189600, 412.0
1506193200, 448.0
1506196800, 429.0
1506200400, 476.0
1506204000, 400.0
1506207600, 218.0
1506211200, 218.0
1506214800, 191.0
1506218400, 237.0
1506222000, 241.0
1506225600, 262.0
1506229200, 295.0
1506232800, 256.0
1506236400, 203.0
1506240000, 193.0
1506243600, 223.0
1506247200, 2608.0
1506250800, 342.0
1506254400, 540.0
1506258000, 456.0
1506261600, 271.0
1506265200, 227.0
1506268800, 1978.0
1506272400, 1910.0
1506276000, 2060.0
1506279600, 465.0
1506283200, 242.0
1506286800, 268.0
1506290400, 240.0
1506294000, 258.0
1506297600, 275.0
1506301200, 202.0
1506304800, 261.0
1506308400, 263.0
1506312000, 634.0
1506315600, 237.0
1506319200, 193.0
1506322800, 237.0
1506326400, 341.0
1506330000, 219.0
1506333600, 218.0
1506337200, 202.0
1506340800, 218.0
1506344400, 196.0
1506348000, 222.0
1506351600, 209.0
1506355200, 235.0
1506358800, 131.0
1506362400, 140.0
1506366000, 163.0
1506369600, 190.0
1506373200, 226.0
1506376800, 673.0
1506380400, 640.0
1506384000, 687.0
1506387600, 297.0
1506391200, 322.0
1506394800, 279.0
1506398400, 237.0
1506402000, 249.0
1506405600, 285.0
1506409200, 232.0
1506412800, 215.0
1506416400, 284.0
1506420000, 1063.0
1506423600, 1035.0
1506427200, 1083.0
1506430800, 961.0
1506434400, 956.0
1506438000, 883.0
1506441600, 893.0
1506445200, 659.0
1506448800, 995.0
1506452400, 466.0
1506456000, 186.0
1506459600, 232.0
1506463200, 257.0
1506466800, 234.0
1506470400, 250.0
1506474000, 236.0
1506477600, 258.0
1506481200, 244.0
1506484800, 187.0
1506488400, 293.0
1506492000, 233.0
1506495600, 156.0
1506499200, 164.0
1506502800, 278.0
1506506400, 233.0
1506510000, 252.0
1506513600, 198.0
1506517200, 324.0
1506520800, 276.0
1506524400, 187.0
1506528000, 247.0
1506531600, 560.0
1506535200, 635.0
1506538800, 256.0
1506542400, 259.0
1506546000, 233.0
1506549600, 260.0
1506553200, 254.0
1506556800, 241.0
1506560400, 177.0
1506564000, 220.0
1506567600, 265.0
1506571200, 191.0
1506574800, 470.0
1506578400, 319.0
1506582000, 225.0
1506585600, 228.0
1506589200, 226.0
1506592800, 265.0
1506596400, 334.0
1506600000, 213.0
1506603600, 244.0
1506607200, 357.0
1506610800, 470.0
1506614400, 376.0
1506618000, 358.0
1506621600, 280.0
1506625200, 345.0
1506628800, 234.0
1506632400, 196.0
1506636000, 193.0
1506639600, 158.0
1506643200, 171.0
1506646800, 217.0
1506650400, 166.0
1506654000, 216.0
1506657600, 208.0
1506661200, 317.0
1506664800, 185.0
1506668400, 247.0
1506672000, 187.0
1506675600, 227.0
1506679200, 174.0
1506682800, 152.0
1506686400, 132.0
1506690000, 197.0
1506693600, 193.0
1506697200, 196.0
1506700800, 175.0
1506704400, 143.0
1506708000, 161.0
1506711600, 135.0
1506715200, 372.0
1506718800, 186.0
1506722400, 210.0
1506726000, 162.0
1506729600, 152.0
1506733200, 232.0
1506736800, 219.0
1506740400, 215.0
1506744000, 247.0
1506747600, 238.0
1506751200, 238.0
1506754800, 157.0
1506758400, 125.0
1506762000, 152.0
1506765600, 184.0
1506769200, 316.0
1506772800, 227.0
1506776400, 634.0
1506780000, 443.0
1506783600, 379.0
1506787200, 2678.0
1506790800, 2019.0
1506794400, 267.0
1506798000, 219.0
1506801600, 246.0
1506805200, 227.0
1506808800, 215.0
1506812400, 318.0
1506816000, 274.0
1506819600, 271.0
1506823200, 269.0
1506826800, 273.0
1506830400, 192.0
1506834000, 235.0
1506837600, 265.0
1506841200, 179.0
1506844800, 364.0
1506848400, 230.0
1506852000, 222.0
1506855600, 8238.0
1506859200, 231.0
1506862800, 229.0
1506866400, 312.0
1506870000, 188.0
1506873600, 541.0
1506877200, 792.0
1506880800, 495.0
1506884400, 226.0
1506888000, 287.0
1506891600, 268.0
1506895200, 275.0
1506898800, 422.0
1506902400, 289.0
1506906000, 279.0
1506909600, 278.0
1506913200, 207.0
1506916800, 245.0
1506920400, 251.0
1506924000, 279.0
1506927600, 257.0
1506931200, 303.0
1506934800, 488.0
1506938400, 361.0
1506942000, 1538.0
1506945600, 504.0
1506949200, 313.0
1506952800, 458.0
1506956400, 2351.0
1506960000, 477.0
1506963600, 1715.0
1506967200, 803.0
1506970800, 542.0
1506974400, 444.0
1506978000, 282.0
1506981600, 199.0
1506985200, 301.0
1506988800, 210.0
1506992400, 261.0
1506996000, 284.0
1506999600, 248.0
1507003200, 295.0
1507006800, 375.0
1507010400, 216.0
1507014000, 209.0
1507017600, 195.0
1507021200, 193.0
1507024800, 259.0
1507028400, 250.0
1507032000, 188.0
1507035600, 279.0
1507039200, 192.0
1507042800, 210.0
1507046400, 224.0
1507050000, 219.0
1507053600, 207.0
1507057200, 171.0
1507060800, 375.0
1507064400, 389.0
1507068000, 262.0
1507071600, 187.0
1507075200, 230.0
1507078800, 382.0
1507082400, 229.0
1507086000, 210.0
1507089600, 228.0
1507093200, 310.0
1507096800, 206.0
1507100400, 209.0
1507104000, 175.0
1507107600, 198.0
1507111200, 150.0
1507114800, 152.0
1507118400, 182.0
1507122000, 225.0
1507125600, 249.0
1507129200, 384.0
1507132800, 233.0
1507136400, 208.0
1507140000, 616.0
1507143600, 425.0
1507147200, 384.0
1507150800, 179.0
1507154400, 201.0
1507158000, 241.0
1507161600, 148.0
1507165200, 160.0
1507168800, 168.0
1507172400, 197.0
1507176000, 166.0
1507179600, 3214.0
1507183200, 296.0
1507186800, 238.0
1507190400, 215.0
1507194000, 185.0
1507197600, 202.0
1507201200, 207.0
1507204800, 189.0
1507208400, 246.0
1507212000, 166.0
1507215600, 268.0
1507219200, 181.0
1507222800, 207.0
1507226400, 228.0
1507230000, 409.0
1507233600, 300.0
1507237200, 250.0
1507240800, 246.0
1507244400, 207.0
1507248000, 210.0
1507251600, 245.0
1507255200, 163.0
1507258800, 231.0
1507262400, 203.0
1507266000, 279.0
1507269600, 221.0
1507273200, 163.0
1507276800, 211.0
1507280400, 566.0
1507284000, 408.0
1507287600, 1585.0
1507291200, 322.0
1507294800, 350.0
1507298400, 310.0
1507302000, 344.0
1507305600, 225.0
1507309200, 117.0
1507312800, 546.0
1507316400, 391.0
1507320000, 397.0
1507323600, 423.0
1507327200, 313.0
1507330800, 400.0
1507334400, 280.0
1507338000, 261.0
1507341600, 235.0
1507345200, 208.0
1507348800, 281.0
1507352400, 196.0
1507356000, 214.0
1507359600, 243.0
1507363200, 438.0
1507366800, 406.0
1507370400, 192.0
1507374000, 189.0
1507377600, 160.0
1507381200, 1612.0
1507384800, 248.0
1507388400, 204.0
1507392000, 233.0
1507395600, 290.0
1507399200, 280.0
1507402800, 244.0
1507406400, 266.0
1507410000, 293.0
1507413600, 220.0
1507417200, 293.0
1507420800, 280.0
1507424400, 301.0
1507428000, 215.0
1507431600, 287.0
1507435200, 310.0
1507438800, 262.0
1507442400, 256.0
1507446000, 195.0
1507449600, 594.0
1507453200, 600.0
1507456800, 611.0
1507460400, 635.0
1507464000, 628.0
1507467600, 554.0
1507471200, 623.0
1507474800, 250.0
1507478400, 2019.0
1507482000, 285.0
1507485600, 713.0
1507489200, 467.0
1507492800, 372.0
1507496400, 273.0
1507500000, 301.0
1507503600, 284.0
1507507200, 281.0
1507510800, 300.0
1507514400, 302.0
1507518000, 282.0
1507521600, 220.0
1507525200, 247.0
1507528800, 289.0
1507532400, 438.0
1507536000, 2726.0
1507539600, 346.0
1507543200, 315.0
1507546800, 274.0
1507550400, 257.0
1507554000, 281.0
1507557600, 360.0
1507561200, 373.0
1507564800, 740.0
1507568400, null
1507572000, null
1507575600, null
1507579200, null
1507582800, null
1507586400, null
1507590000, null
1507593600, null
1507597200, null
1507600800, null
1507604400, null
1507608000, null
1507611600, null
1507615200, null
1507618800, null
1507622400, null
1507626000, null
1507629600, null
1507633200, null
1507636800, null
1507640400, null
1507644000, null
1507647600, null
1507651200, null
1507654800, null
1507658400, null
1507662000, null
1507665600, null
1507669200, null
1507672800, null
1507676400, null
1507680000, null
1507683600, null
1507687200, null
1507690800, null
1507694400, null
1507698000, null
1507701600, null
1507705200, null
1507708800, null
1507712400, null
1507716000, null
1507719600, null
1507723200, null
1507726800, null
1507730400, null
1507734000, null
1507737600, null
1507741200, null
1507744800, null
1507748400, null
1507752000, null
1507755600, null
1507759200, null
1507762800, null
1507766400, null
1507770000, null
1507773600, null
1507777200, null
1507780800, null
1507784400, null
1507788000, null
1507791600, null
1507795200, null
1507798800, null
1507802400, null
1507806000, null
1507809600, null
1507813200, null
1507816800, null
1507820400, null
1507824000, null
1507827600, null
1507831200, null
1507834800, null
1507838400, null
1507842000, null
1507845600, null
1507849200, null
1507852800, null
1507856400, null
1507860000, null
1507863600, null
1507867200, null
1507870800, null
1507874400, null
1507878000, null
1507881600, null
1507885200, null
1507888800, null
1507892400, null
1507896000, null
1507899600, null
1507903200, null
1507906800, null
1507910400, null
1507914000, null
1507917600, null
1507921200, null
1507924800, null
1507928400, null
1507932000, null
1507935600, null
1507939200, null
1507942800, null
1507946400, null
1507950000, null
1507953600, null
1507957200, null
1507960800, null
1507964400, null
1507968000, null
1507971600, null
1507975200, null
1507978800, null
1507982400, null
1507986000, null
1507989600, null
1507993200, null
1507996800, null
1508000400, null
1508004000, null
1508007600, null
1508011200, null
1508014800, null
1508018400, null
1508022000, null
1508025600, null
1508029200, null
1508032800, null
1508036400, null
1508040000, null
1508043600, null
1508047200, null
1508050800, null
1508054400, null
1508058000, null
1508061600, null
1508065200, null
1508068800, null
1508072400, null
1508076000, null
1508079600, null
1508083200, null
1508086800, null
1508090400, null
1508094000, null
1508097600, null
1508101200, null
1508104800, null
1508108400, null
1508112000, null
1508115600, null
1508119200, null
1508122800, null
1508126400, null
1508130000, null
1508133600, null
1508137200, null
1508140800, null
1508144400, null
1508148000, null
1508151600, null
1508155200, null
1508158800, null
1508162400, null
1508166000, null
1508169600, null
1508173200, null
1508176800, null
1508180400, null
1508184000, null
1508187600, null
1508191200, null
1508194800, null
1508198400, null
1508202000, null
1508205600, null
1508209200, null
1508212800, null
1508216400, null
1508220000, null
1508223600, null
1508227200, null
1508230800, null
1508234400, null
1508238000, null
1508241600, null
1508245200, null
1508248800, null
1508252400, null
1508256000, null
1508259600, null
1508263200, null
1508266800, null
1508270400, null
1508274000, null
1508277600, null
1508281200, null
1508284800, null
1508288400, null
1508292000, null
1508295600, null
1508299200, null
1508302800, null
1508306400, null
1508310000, null
1508313600, null
1508317200, null
1508320800, null
1508324400, null
1508328000, null
1508331600, null
1508335200, null
1508338800, null
1508342400, null
1508346000, null
1508349600, null
1508353200, null
1508356800, null
1508360400, null
1508364000, null
1508367600, null
1508371200, null
1508374800, null
1508378400, null
1508382000, null
1508385600, null
1508389200, null
1508392800, null
1508396400, null
1508400000, null
1508403600, null
1508407200, null
1508410800, null
1508414400, null
1508418000, null
1508421600, null
1508425200, null
1508428800, null
1508432400, null
1508436000, null
1508439600, null
1508443200, null
1508446800, null
1508450400, null
1508454000, null
1508457600, null
1508461200, null
1508464800, null
1508468400, null
1508472000, null
1508475600, null
1508479200, null
1508482800, null
1508486400, null
1508490000, null
1508493600, null
1508497200, null
1508500800, null
1508504400, null
1508508000, null
1508511600, null
1508515200, null
1508518800, null
1508522400, null
1508526000, null
1508529600, null
1508533200, null
1508536800, 319.0
1508540400, 214.0
1508544000, 248.0
1508547600, 250.0
1508551200, 212.0
1508554800, 274.0
1508558400, 212.0
1508562000, 251.0
1508565600, 221.0
1508569200, 294.0
1508572800, 322.0
1508576400, 335.0
1508580000, 266.0
1508583600, 281.0
1508587200, 234.0
1508590800, 200.0
1508594400, 186.0
1508598000, 284.0
1508601600, 223.0
1508605200, 219.0
1508608800, 225.0
1508612400, 694.0
1508616000, 665.0
1508619600, 311.0
1508623200, 305.0
1508626800, 171.0
1508630400, 200.0
1508634000, 159.0
1508637600, 214.0
1508641200, 259.0
1508644800, 251.0
1508648400, 269.0
1508652000, 186.0
1508655600, 235.0
1508659200, null
1508662800, null
The devices here are hooked up to the same NTP server so I think the odds of this being a time sync issue being reduced, especially as the browser of a client machine looking at the page served by the emonpi’s webber er shouldn’t be able to affect things like this.
I will not be in the position I’m in now if this happens again as I will have logs and I will take more screen grabs. I remember checking the feeds page that night before the reboot and the update interval was red and just a hyphen. I clicked to refresh but it did nothing. It was so late I the evening I chose to reboot 
Thanks for your help here and suggestions. Hopefully one of the names you’ve tagged with be able to shed some light on what may have happened.