Hi everybody,
I have a feed logging calculated Power values for Solar generation.
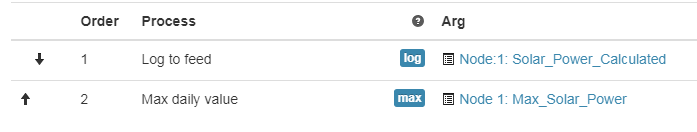
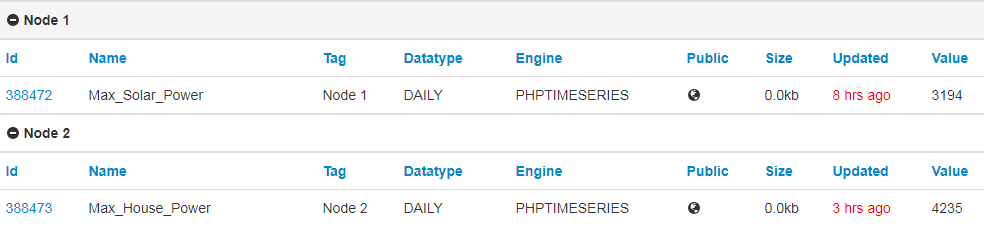
My understanding is that the maximum value will be stored for every 24 hour period and can be displayed on a bar graph.
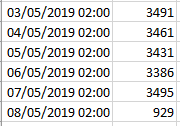
Exported values below:
All works well, except for the bar graph display.
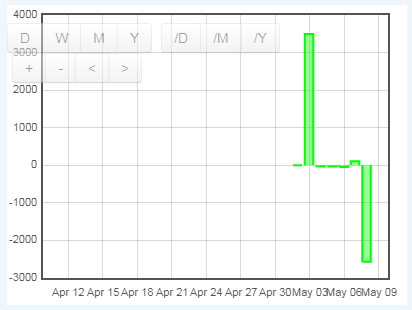
Any ideas where I’m possibly doing something wrong, but all setups looks to be in order.
Thanks.
Flip