Inputs and Feeds Lost

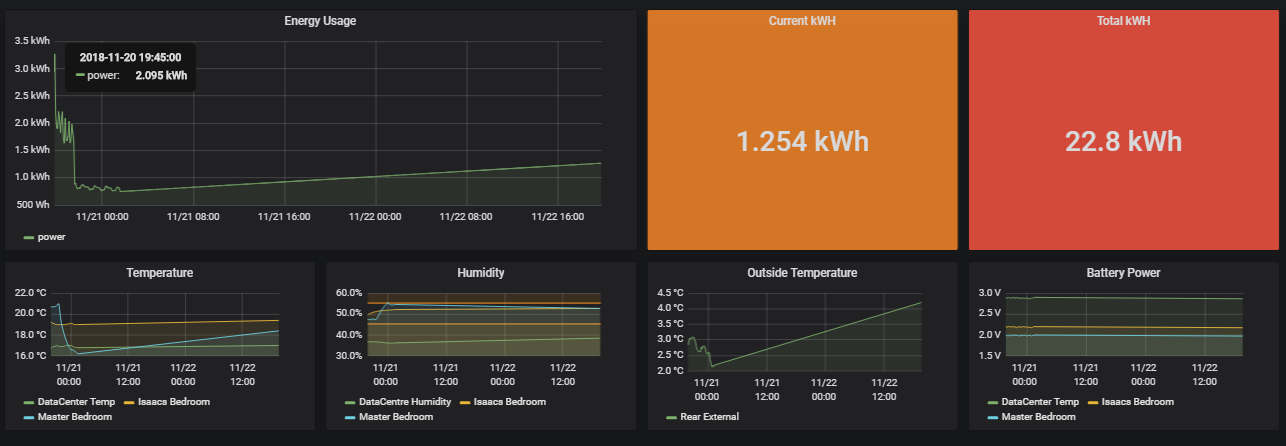
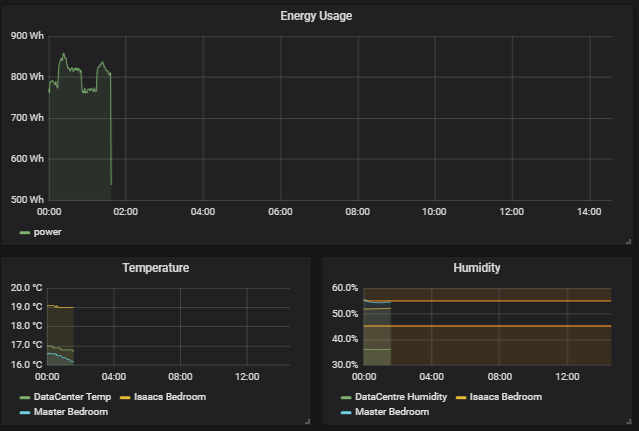
It seems that at 1am this morning my emonPi stopped reporting any values from the 4 sensors that I’ve got setup.
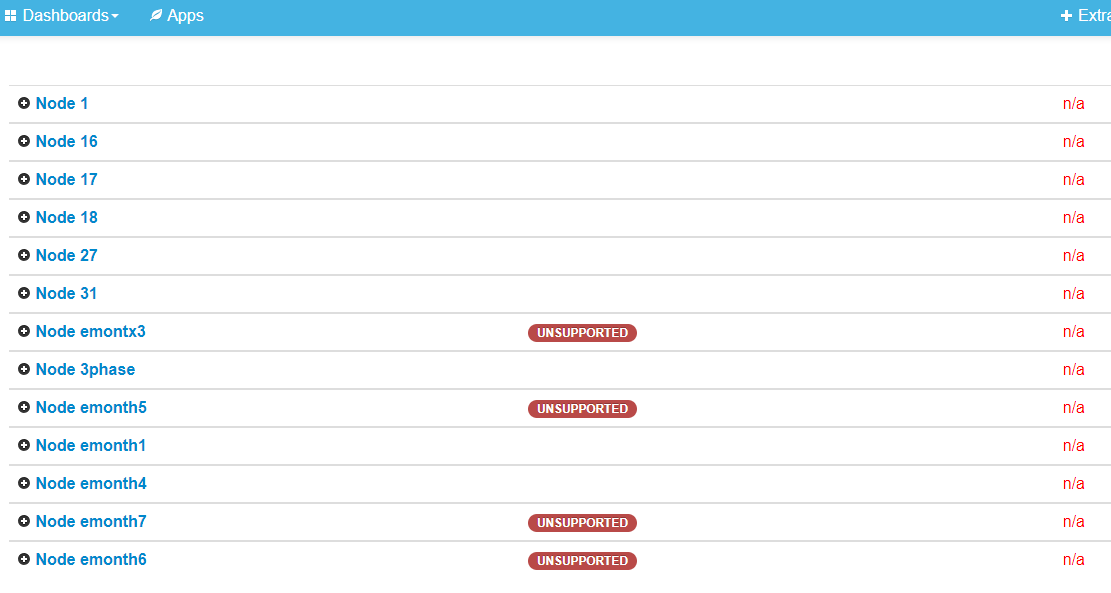
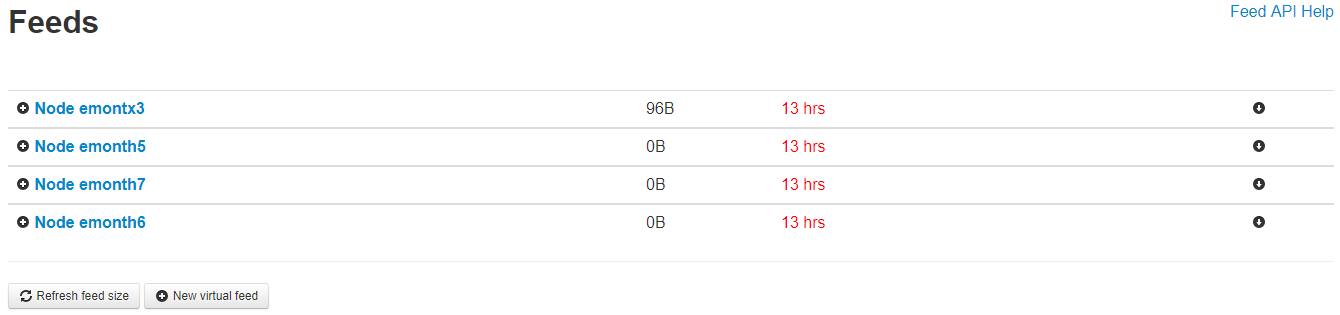
When I go to feeds, they all say nothing received for X hours (x being the number of hours passed since 1am). I find it odd that all sensors went out at the exact same time. All the available inputs are also marked with n/a.

Unfortunately, I rebooted the pi after I did some research and found that would wipe any logs stored in RAM… I’ve also search on these forums to see if others have experienced this issue and I can’t find anything.

grafana


If it helps these are the logs from the webgui.
2018-11-21 07:51:17.246|WARN|phpmqtt_input.php|Not connected, retrying connection
2018-11-21 07:51:17.327|WARN|phpmqtt_input.php|Connecting to MQTT server: Connection Accepted.: code: 0
2018-11-21 07:51:24.502|WARN|phpmqtt_input.php|Not connected, retrying connection
2018-11-21 07:51:24.523|WARN|phpmqtt_input.php|Connecting to MQTT server: Connection Accepted.: code: 0
2018-11-21 07:52:56.540|WARN|phpmqtt_input.php|Not connected, retrying connection
2018-11-21 07:52:56.567|WARN|phpmqtt_input.php|Connecting to MQTT server: Connection Accepted.: code: 0
2018-11-21 13:13:59.843|WARN|phpmqtt_input.php|Not connected, retrying connection
2018-11-21 13:13:59.869|WARN|phpmqtt_input.php|Connecting to MQTT server: Connection Accepted.: code: 0
2018-11-21 13:33:37.330|WARN|phpmqtt_input.php|Not connected, retrying connection
2018-11-21 13:33:37.384|WARN|phpmqtt_input.php|Connecting to MQTT server: Connection Accepted.: code: 0

The things I’ve tried:

  1. Checked the time of the pi, all seems fine (people mentioned this in some forum posts being a problem).
  2. rebooted the pi and sensors around the house

Not sure what else I could check, it seems the receiver isn’t picking up any signals, could that have gone? How do I check thats working correctly?

More logs
2018-11-21 13:33:26,513 INFO MainThread Creating EmonHubMqttInterfacer ‘MQTT’
2018-11-21 13:33:26,514 DEBUG RFM2Pi acknowledged command: > 0q
2018-11-21 13:33:26,518 DEBUG MainThread Setting MQTT subchannels: [‘ToEmonCMS’]
2018-11-21 13:33:26,519 DEBUG MainThread Setting MQTT pubchannels: [‘ToRFM12’]
2018-11-21 13:33:26,520 INFO MainThread Setting MQTT nodevar_format_enable: 1
2018-11-21 13:33:26,520 INFO MainThread Setting MQTT node_format_enable: 1
2018-11-21 13:33:26,521 INFO MainThread Setting MQTT nodevar_format_basetopic: emon/
2018-11-21 13:33:26,522 INFO MainThread Creating EmonHubEmoncmsHTTPInterfacer ‘emoncmsorg’
2018-11-21 13:33:26,524 DEBUG MainThread Setting emoncmsorg subchannels: [‘ToEmonCMS’]
2018-11-21 13:33:26,524 DEBUG MainThread Setting emoncmsorg pubchannels: [‘ToRFM12’]
2018-11-21 13:33:26,525 INFO MainThread Setting emoncmsorg url: https://emoncms.org
2018-11-21 13:33:26,525 INFO MainThread Setting emoncmsorg senddata: 1
2018-11-21 13:33:26,526 INFO MainThread Setting emoncmsorg apikey: set
2018-11-21 13:33:26,526 INFO MainThread Setting emoncmsorg sendstatus: 1
2018-11-21 13:33:26,618 DEBUG RFM2Pi device settings updated: E i5 g210 @ 433 MHz
2018-11-21 13:33:26,719 DEBUG RFM2Pi acknowledged command: > 1p
2018-11-21 13:33:27,027 DEBUG RFM2Pi acknowledged command: i - set node ID (standard node ids are 1…30)
2018-11-21 13:33:27,132 DEBUG RFM2Pi acknowledged command: b - set MHz band (4 = 433, 8 = 868, 9 = 915)
2018-11-21 13:33:27,238 DEBUG RFM2Pi acknowledged command: o - change frequency offset within the band (default 1600)
2018-11-21 13:33:27,449 DEBUG RFM2Pi acknowledged command: g - set network group (RFM12 only allows 212, 0 = any)
2018-11-21 13:33:27,553 DEBUG RFM2Pi acknowledged command: c - set collect mode (advanced, normally 0)
2018-11-21 13:33:27,763 DEBUG RFM2Pi acknowledged command: …, a - send data packet to node , request ack
2018-11-21 13:33:27,868 DEBUG RFM2Pi acknowledged command: …, s - send data packet to node , no ack
2018-11-21 13:33:27,973 DEBUG RFM2Pi acknowledged command: q - set quiet mode (1 = don’t report bad packets)
2018-11-21 13:33:28,079 DEBUG RFM2Pi acknowledged command: x - set reporting format (0: decimal, 1: hex, 2: hex+ascii)
2018-11-21 13:33:28,185 DEBUG RFM2Pi acknowledged command: y - enable signal strength trace mode, default:0 (disabled)
2018-11-21 13:33:28,291 DEBUG RFM2Pi acknowledged command: sample interval secs/100 (0.01s-2.5s) eg 10y=0.1s
2018-11-21 13:33:28,624 DEBUG RFM2Pi acknowledged command: , f - FS20 command (868 MHz)
2018-11-21 13:33:28,730 DEBUG RFM2Pi acknowledged command: , k - KAKU command (433 MHz)
2018-11-21 13:33:28,935 DEBUG RFM2Pi device settings updated: E i5 g210 @ 433 MHz

Hello @pu43x, did your inputs list ‘unsupported’ tags prior to this happening? there was an issue with this effect recently following running emonpi update. Is there any chance that an update was somehow initiated?

Could you copy and paste the info in Administration > Server Administration here, using the copy to clip board feature.

Hey, thanks for replying. The last time I checked which was only 19 days ago as I added 2 more temp sensors it all looked fine.
I’m not entirely sure what happened at 1am this morning but I didn’t upgrade prior to that I think. It just runs and has done pretty solid for nearly 2 years now.

Below is the dump of the system information.

Server Information
Emoncms Version low-write 9.9.5
Modules Administration : App v1.2.0 : Backup v1.1.5 : EmonHub Config v1.0.0 : Dashboard v1.3.1 : Device v1.2.0 : EventProcesses : Feed : Graph v1.2.1 : Input : Postprocess v1.0.0 : CoreProcess : Schedule : Network Setup v1.0.0 : sync : Time : User : Visualisation : WiFi v1.3.0
Git URL GitHub - emoncms/emoncms: Web-app for processing, logging and visualising energy, temperature and other environmental data
Git Branch * stable
Buffer loading…
Writer Daemon is running with sleep 60s
Server OS Linux 4.4.26-v7+
Host emonpi emonpi (192.168.5.206)
Date 2018-11-21 16:52:51 UTC
Uptime 16:52:51 up 9:02, 0 users, load average: 0.04, 0.10, 0.08
HTTP Server Apache/2.4.10 (Raspbian) HTTP/1.1 CGI/1.1 80
MySQL Version 5.5.52-0+deb8u1
Host 127.0.0.1 (127.0.0.1)
Date 2018-11-21 16:52:51 (UTC 00:00‌​)
Stats Uptime: 32701 Threads: 3 Questions: 7473 Slow queries: 0 Opens: 61 Flush tables: 1 Open tables: 54 Queries per second avg: 0.228
Redis Version 2.8.17
Host localhost:6379 (127.0.0.1)
Size 255 keys (512.52K)
Uptime 0 days
MQTT Server Version Mosquitto 1.4.10
Host localhost:1883 (127.0.0.1)
Pi Model Raspberry Pi 3 Model B Rev 1.2 - 1 GB (Sony UK)
SoC Broadcom BCM2709
Serial num. 985C6363
Temperature CPU: 46.16°C - GPU: 45.6’C
Release emonSD-07Nov16
File-system Current: read-only - Set root file-system temporarily to read-write, (default read-only)
Memory RAM Used: 26.24% Total: 973.11 MB Used: 255.38 MB Free: 717.73 MB
Disk Mount Stats
/ Used: 58.66% Total: 3.33 GB Used: 1.95 GB Free: 1.22 GB
/boot Used: 34.72% Total: 59.95 MB Used: 20.81 MB Free: 39.13 MB
/home/pi/data Used: 2.90% Total: 3.46 GB Used: 102.9 MB Free: 3.18 GB
PHP Version 5.6.27-0+deb8u1 (Zend Version 2.6.0)
Modules apache2handler : bcmath : bz2 : calendar : Core v5.6.27-0+deb8u1 : ctype : curl : date v5.6.27-0+deb8u1 : dba : dio v0.0.4RC4 : dom v20031129 : ereg : exif v1.4 $Id: 8b0e34c10dc8a04b8e81d9d79985b2566141b03d $ : fileinfo v1.0.5 : filter v0.11.0 : ftp : gettext : hash v1.0 : iconv : json v1.3.6 : libxml : mbstring : mcrypt : mhash : mosquitto v0.3.0 : mysql v1.0 : mysqli v0.1 : openssl : pcre : PDO v1.0.4dev : pdo_mysql v1.0.2 : Phar v2.0.2 : posix : readline v5.6.27-0+deb8u1 : redis v2.2.7 : Reflection v$Id: 5f15287237d5f78d75b19c26915aa7bd83dee8b8 $ : session : shmop : SimpleXML v0.1 : soap : sockets : SPL v0.2 : standard v5.6.27-0+deb8u1 : sysvmsg : sysvsem : sysvshm : tokenizer v0.1 : wddx : xml : xmlreader v0.1 : xmlwriter v0.1 : Zend OPcache v7.0.6-devFE : zip v1.12.5 : zlib v2.0
Client Information
HTTP Browser Mozilla/5.0 (Windows NT 10.0; Win64; x64) AppleWebKit/537.36 (KHTML, like Gecko) Chrome/70.0.3538.102 Safari/537.36
Screen Resolution 1366 x 768
Window Size 1349 x 636

Thanks for the server information. If you still see the ‘unsupported’ messages on your input list, could you try clearing your browsers cache?

It might also be worth running emonpi update again. Is it an emonpi or an emonbase, your nodes in the input list suggest an emonbase?

Hey, Thanks. Cleared my cache and that removed the “unsupported” tag.

You’re correct, I do have the emonBase, I’ve just run the update and below is the latest System Information. Is there any way I can check if it’s able to receive anything. It’s just odd that all nodes have dropped out.

Server Information
Emoncms Version low-write 9.9.5
Modules Administration : App v1.2.0 : Backup v1.1.5 : EmonHub Config v1.0.0 : Dashboard v1.3.1 : Device v1.2.0 : EventProcesses : Feed : Graph v1.2.1 : Input : Postprocess v1.0.0 : CoreProcess : Schedule : Network Setup v1.0.0 : sync : Time : User : Visualisation : WiFi v1.3.0
Git URL GitHub - emoncms/emoncms: Web-app for processing, logging and visualising energy, temperature and other environmental data
Git Branch * stable
Buffer loading…
Writer Daemon is running with sleep 60s
Server OS Linux 4.4.26-v7+
Host emonpi emonpi (192.168.5.206)
Date 2018-11-21 19:26:20 UTC
Uptime 19:26:20 up 11:35, 0 users, load average: 0.15, 0.10, 0.04
HTTP Server Apache/2.4.10 (Raspbian) HTTP/1.1 CGI/1.1 80
MySQL Version 5.5.52-0+deb8u1
Host 127.0.0.1 (127.0.0.1)
Date 2018-11-21 19:26:20 (UTC 00:00‌​)
Stats Uptime: 41910 Threads: 3 Questions: 8436 Slow queries: 0 Opens: 61 Flush tables: 1 Open tables: 54 Queries per second avg: 0.201
Redis Version 2.8.17
Host localhost:6379 (127.0.0.1)
Size 255 keys (512.52K)
Uptime 0 days
MQTT Server Version Mosquitto 1.4.10
Host localhost:1883 (127.0.0.1)
Pi Model Raspberry Pi 3 Model B Rev 1.2 - 1 GB (Sony UK)
SoC Broadcom BCM2709
Serial num. 985C6363
Temperature CPU: 46.70°C - GPU: 47.2’C
Release emonSD-07Nov16
File-system Current: read-only - Set root file-system temporarily to read-write, (default read-only)
Memory RAM Used: 26.28% Total: 973.11 MB Used: 255.77 MB Free: 717.34 MB
Disk Mount Stats
/ Used: 58.66% Total: 3.33 GB Used: 1.95 GB Free: 1.22 GB
/boot Used: 34.72% Total: 59.95 MB Used: 20.81 MB Free: 39.13 MB
/home/pi/data Used: 2.90% Total: 3.46 GB Used: 102.9 MB Free: 3.18 GB
PHP Version 5.6.27-0+deb8u1 (Zend Version 2.6.0)
Modules apache2handler : bcmath : bz2 : calendar : Core v5.6.27-0+deb8u1 : ctype : curl : date v5.6.27-0+deb8u1 : dba : dio v0.0.4RC4 : dom v20031129 : ereg : exif v1.4 $Id: 8b0e34c10dc8a04b8e81d9d79985b2566141b03d $ : fileinfo v1.0.5 : filter v0.11.0 : ftp : gettext : hash v1.0 : iconv : json v1.3.6 : libxml : mbstring : mcrypt : mhash : mosquitto v0.3.0 : mysql v1.0 : mysqli v0.1 : openssl : pcre : PDO v1.0.4dev : pdo_mysql v1.0.2 : Phar v2.0.2 : posix : readline v5.6.27-0+deb8u1 : redis v2.2.7 : Reflection v$Id: 5f15287237d5f78d75b19c26915aa7bd83dee8b8 $ : session : shmop : SimpleXML v0.1 : soap : sockets : SPL v0.2 : standard v5.6.27-0+deb8u1 : sysvmsg : sysvsem : sysvshm : tokenizer v0.1 : wddx : xml : xmlreader v0.1 : xmlwriter v0.1 : Zend OPcache v7.0.6-devFE : zip v1.12.5 : zlib v2.0
Client Information
HTTP Browser Mozilla/5.0 (Windows NT 10.0; Win64; x64) AppleWebKit/537.36 (KHTML, like Gecko) Chrome/70.0.3538.102 Safari/537.36
Screen Resolution 1366 x 768
Window Size 1349 x 636

Great, Did you run the emonbase update rather than the emonpi one? I assume the inputs and feeds are still not updating?

Hey, you, I ran the emonbase update and it completed correctly.

Inputs and feeds are still not updating.

Good to hear emonbase update completed correctly. Do you see any more activity than what you copied above in emonhub.log? (Setup > EmonHub > view log)

So I checked this evening and 3 out of 4 sensors were correctly updating, I noticed that the emontx3 actually needed it’s batteries replacing, it had been going for 649 days! Unsure why this could have caused the others to stop reporting though…

Everything is back up and running, thanks for your help. I monitor the power for all the emonth’s but it doesn’t look like there is a feed for the battery power on the emontx. Bottom left of the screenshot below.

Turns out that the root cause could have just been the battery running out on the emontx… Still unsure why this would knock out the other sensors.

Thanks for your help. :slight_smile:

1 Like

Great to hear you have it working again! At which point did the emonth’s start working again? was it after the update or prior to that? 649 days is a good run! :slight_smile:

It was after the update. But I didn’t notice it immediately, only tonight.