Hi
I’m setting up in initial configuration of Emoncms and need some advice please.
It’s locally hosted on an Ubuntu server guest VM.
The two inputs I have are non-standard I guess - power1 is from a CurrentCost monitor. This input is in current watts, read by a Python script and fed to Emoncms via HTTP input API. All seems well and reporting is appearing to go well. power2 takes its input from Solaredge PV panels, via an api to Solaredge itself. This is “current watts produced”, read via a Python script and fed to Emoncms via HTTP API. All seems well and reporting is appearing to go well.
power1 is intermittent and updates vary between 1 - 2 minutes.
power2 reports every 10 minutes.
CT1 for power1 is located on the “inside” side of the utility meter, as per Type 2.
power2, taking its feed directly from Solaredge is on the “inside” side of the inverter.
Due to the wiring in my house I cannot see i immediately whether I should configure as Type1 or Type2
As an experiment, I’ve duplicated my inputs so that I have set up a both Type1 and Type2 to discover which is appropriate - however although both configurations appear to be working fine, neither produces an input or use kwH figure that closely matches my utility meter.
I’d appreciate an opinion - is my setup capable of producing a viable configuration?
If so, and I can determine whether I’m Type1 or Type2, could my difference between Emoncms figures and the utility meter be down to the irregularity of reporting?
You do have a few problems there. I presume you’ve looked at the diagram regarding the difference between a Type 1 and a Type 2. A Type 1 is where you can measure the house consumption and the PV generation separately; a Type 2 is where you measure the Grid power and the PV Generation.
The important points are In a Type 1, the power flow is always only one way at each place you measure In a Type 2, the grid power can flow either way and is signed to indicate the direction.
So, it comes down to this: where is your CurrentCost monitor’s c.t. (in relation to the PV input), and does your CurrentCost read negative values when you’re exporting? Because that’s essential for a Type 2 set-up to work. I’m not familiar with CurrentCost monitors, but looking at what information I can find, there’s every indication that it doesn’t.
I think, for a Type 2 installation (which might be the only practical one, and if I’m right about your CurrentCost monitor), you might have to abandon the CurrentCost monitor and replace it with something that does measure negative power when exporting - probably an emonTx with either the ESP8266 Wi-Fi adapter or a Raspberry Pi ZeroW, that would feed directly to your server.
If you can’t or don’t want to go down that route and must use your CurrentCost monitor, then your only option is to put the c.t. where it will only see consumption, not generation. In other words, the PV connection must be on the meter side of the CurrentCost c.t. and on the connection to the rest of your wiring. And I guess that is what you can’t find out?
There might just be an alternative, if you’re handy with electronics and your Grid meter has an LED that lights continuously when exporting: Monitor the state of that LED, and when it’s on for more than a flash, make the CurrentCost monitor’s reading negative inside emonCMS. We don’t have a sensor that’s capable of that off-the-shelf, and processing that data is not built in to emonCMS. But I think it might be possible. You’ve got to judge whether it’s practical.
Having the two powers at different times is just adding to the confusion, there’s not much you can do about that other than to restrict yourself to looking at long-term trends.
Hi Robert - thanks for your speedy and detailed post - it’s been v useful.
Apologies for this delayed followup - I’ve been experimenting and each iteration of placing the clamp took a couple of days to collect data/readings.
As an update for anyone else that may be experiencing similar - I’ve never seen a negative value from my CurrentCost device so this severely limits its usefulness in this case.
This appears to be a common problem with most, if not all, similar devices. From my point of view as an electrical engineer, they’re really only good for comparative indications of energy usage. They won’t show the power accurately - for a simple reason: by design, they cannot measure power. The better (maybe I should say ‘least worse’') ones measure current and assume the voltage is a fixed value that you tell it. The even worse ones don’t even allow you to set what you perceive as the ‘average’ voltage. The best you can normally encounter are the ones that measure both voltage and current, but even then, they almost always use a remote sensor for the current which means they still cannot calculate the power accurately, because they only get the average current and average voltage and multiply the two, and that takes no account of the fact that an electric kettle consumes more power for a given current than a central heating pump or a fridge motor. And for exactly the same reason, they can’t detect the direction of power flow.
As soon as I see that the current sensor is battery powered and remote, it’s all but 100% certain that the device cannot measure real power.
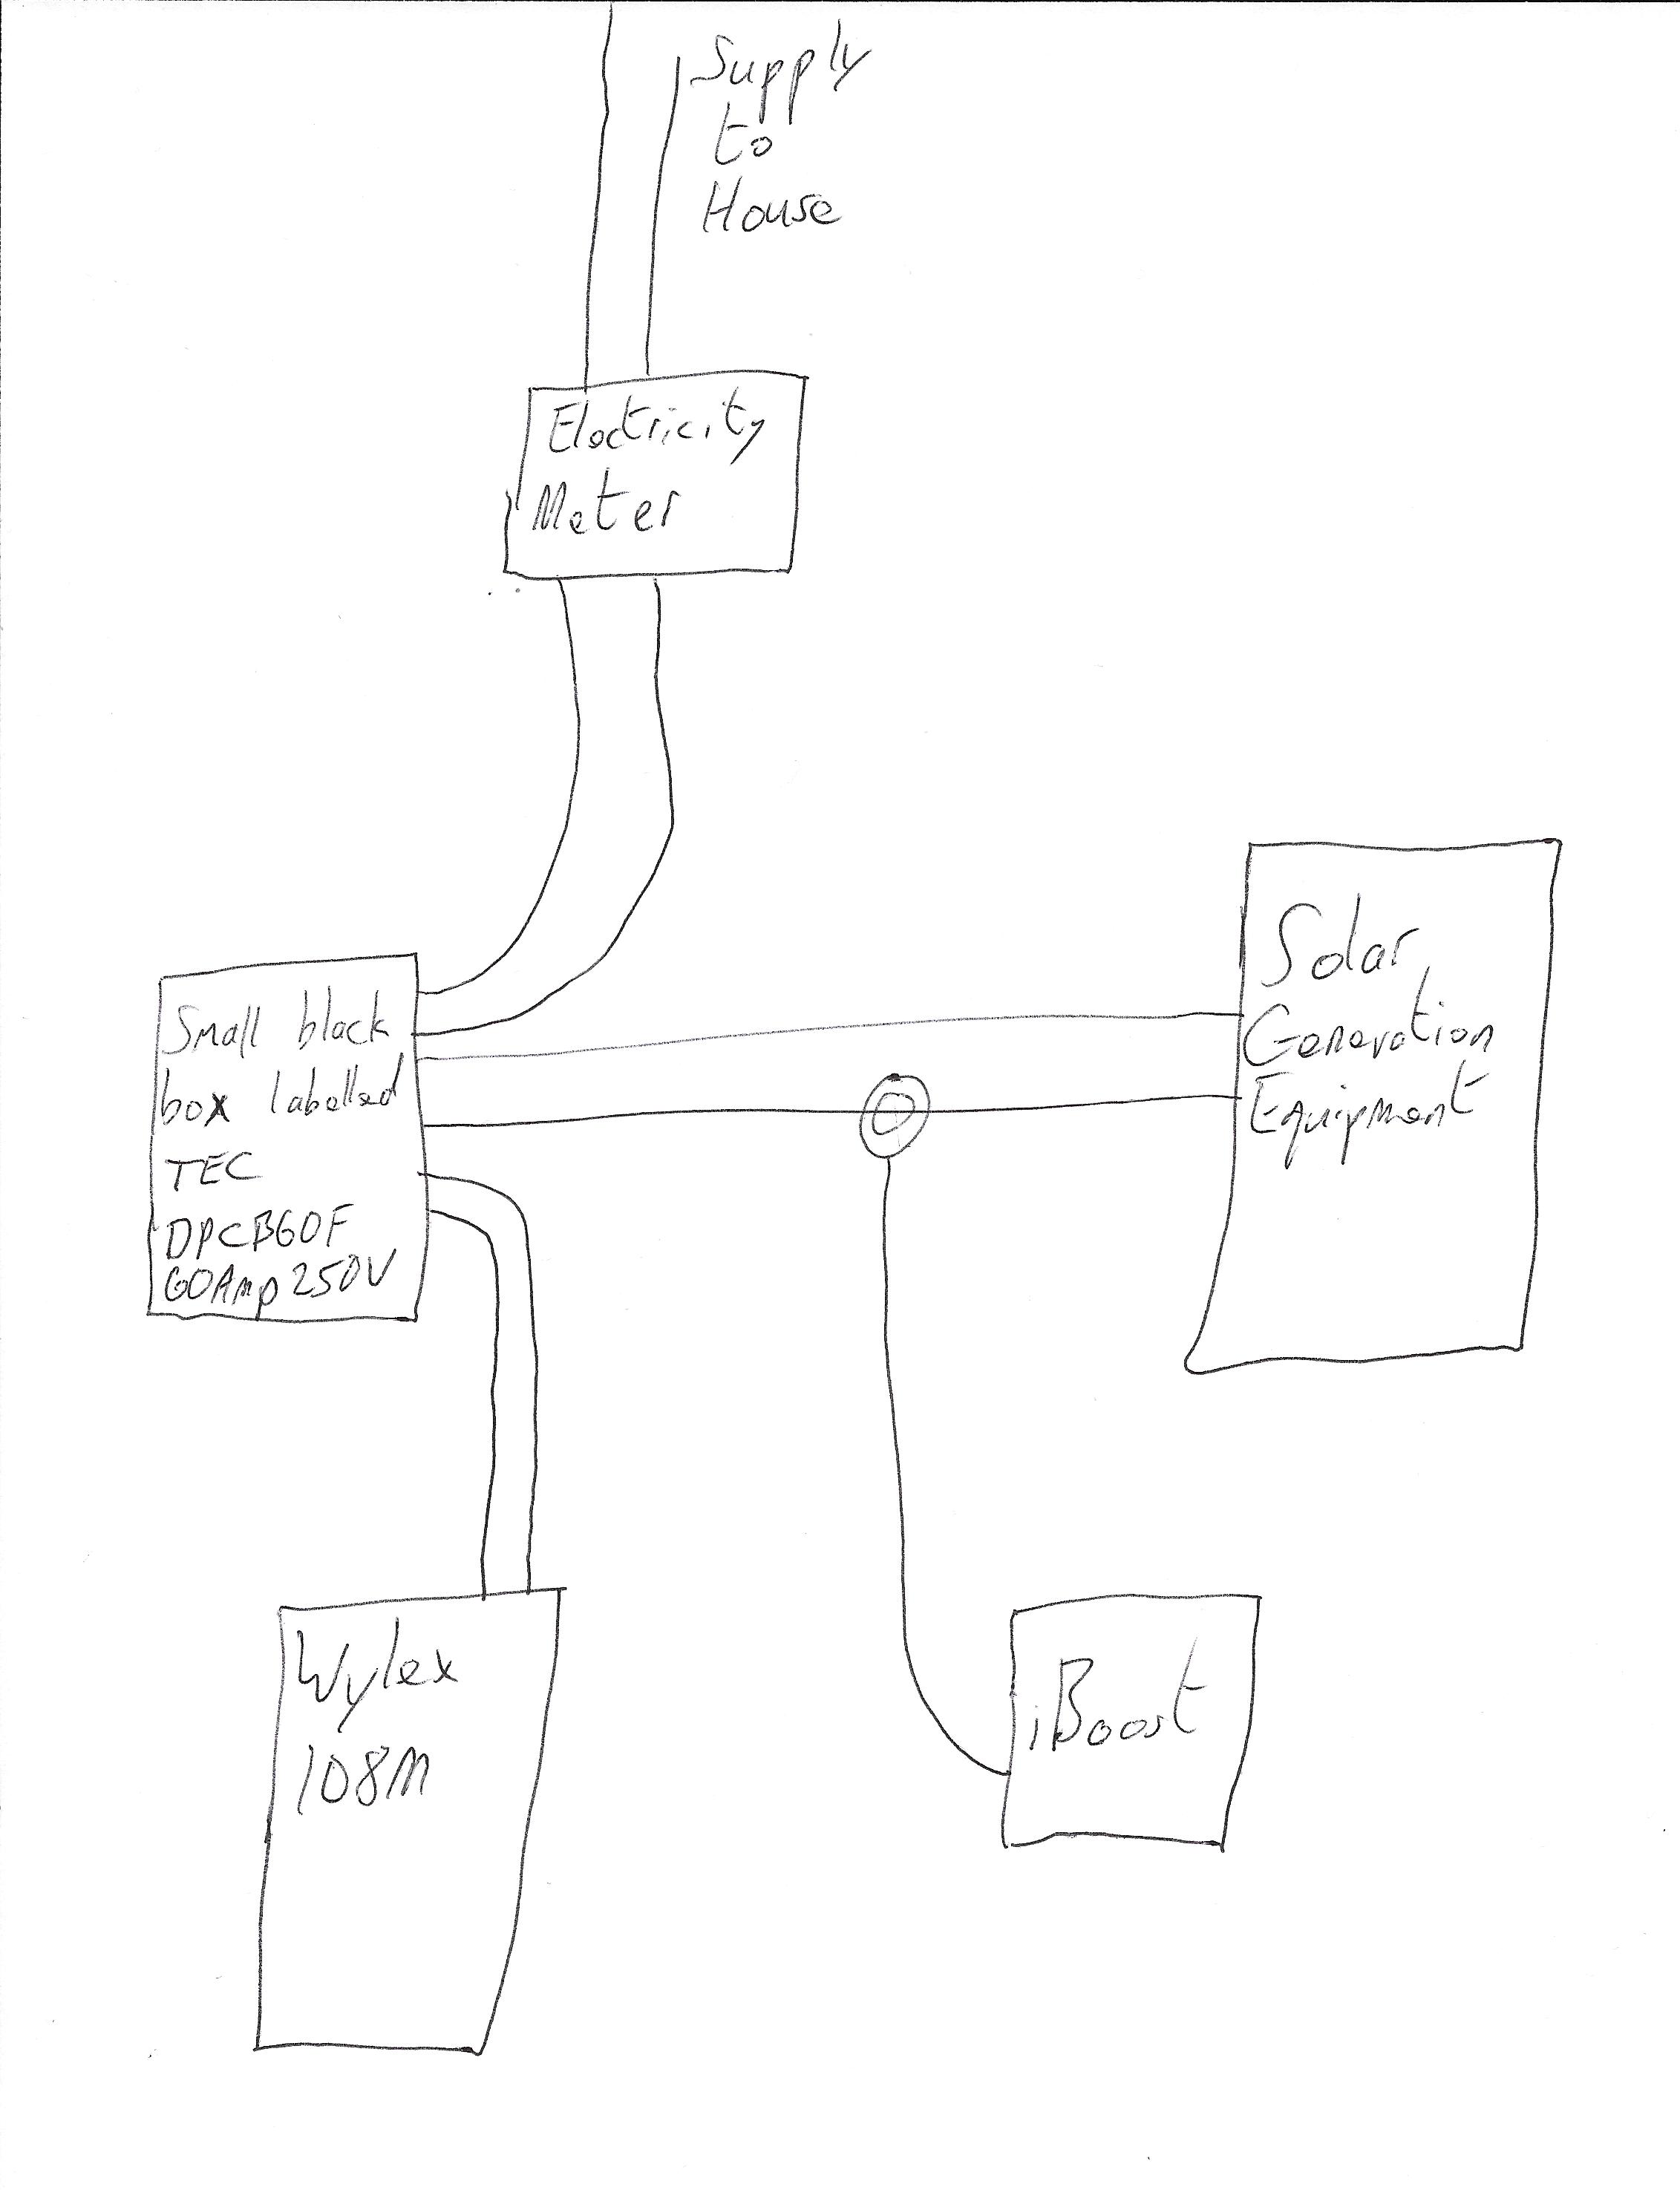
If you provide a single line diagram of you installation, showing your meter, consumer unit and where the PV connects in, I might be able to offer some more suggestions.
Tied in with that, how familiar are you with domestic electrical installations? Because I don’t want to suggest something that would lead you into danger.
The consumer unit is at the other side of a room to the equipment outlined in the diag, but I assume it is connected via the Wylex and the cables are hidden from me.
The iBoost is irrelevant to this issue I guess, but I’ve indicated where my installer placed the clamp in case it helps.
I understand the limitations of the CurrentCost device so am not expecting miracles, I guess I’m just trying to do the best I can with what I have, then take it from there.
The solar generation numbers in watts are taken from the Solaredge api and are presumably accurate, but 10 minutes apart - I understand that this is not ideal but my main aim I guess is to understand how much I’m exporting over time so to inform decisions about domestic batteries or charging an electric vehicle (say).
I’m reasonably familiar with domestic installations, I’ve added spurs where allowed, etc
If you can transfer the CurrentCost monitor onto the feed to the Wylex 108m (and provided your assumption that this is the feed to the rest of the house, which indeed looks to be the case, is true - and it’s easy to test, if you turn it off and everything goes off, it is!), then you will have a Type 1 installation and it should work, but maybe not perfectly, with the CurrentCost device as CT1 and the SolarEdge feed as CT2.
CurrentCost won’t give you the number its name implies - but it never did that anyway as soon as you started exporting PV (it cannot distinguish export from import, so it would show export as a cost to you) but in its new place, it will give you the cost of your consumption, and emonCMS will show you the nett energy flow as well as the contributions from the other two.
The problems will be that CurrentCost will only be calculating apparent power, not real power, so you will have a source of inaccuracy there (compared to an emonTx or emonPi), but as I see it, the biggest problem is likely to be the fact that the two important data items won’t be synchronised. I’m not sure what the effect will be on the resulting data in the short term, but long-term I think the numbers should give you a good guide.
If it turns out that the information you’re getting isn’t satisfactory, then I’d suggest adding an emonTx with two c.t’s, an a.c. adapter and a 5 V d.c. power and feed its data into (recommended by my colleague Brian - @borpin) a Pi Zero W which can run emonCMS plus send the data onwards to your server, and then with CT1 on the feed from the meter and CT2 on the feed from the PV (where the iBoost c.t. is) you’d have a Type 2 set-up, and you’d have two spare c.t inputs which you could use for the batteries and EV. (provided the feeds started somewhere within reach of the emonTx).
Apologies if the diagram wasn’t appropriate - I’ll admit I wasn’t sure what you needed so searched back in the forums and tried to replicate what others had done.
Thanks for your swift response once more - I’ll experiment with this and the results for the next few days, and report back to here in case it’s useful for anyone else searching.
A “Single Line Diagram” is just what it says - a single line. Earths and Neutrals are left out in most cases, so there’s just one line representing the main connections.
In case somebody finds and is looking to see what a single line diagram is, this is how I would show it: