Hi all, I am struggling with getting accurate data on a particular feed and I hoping someone sharper than me can spot what I am doing wrong.
We’ve heavily bought into eMonCMS. We’ve got an emonPi + 2x CTs, 1x EmonTX + 1 CT and 1x EmonTX + 3 CTs. So 6 clamps in total.
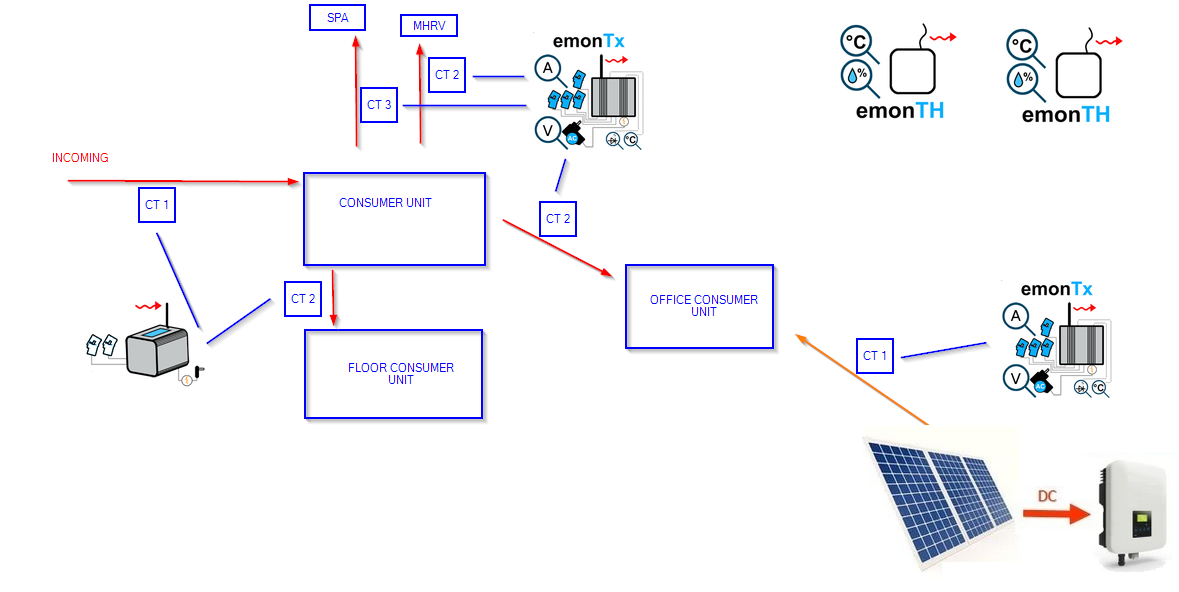
Here’s a diagram. The areas of interest are the main incoming CT, the office CT and the solar CT.
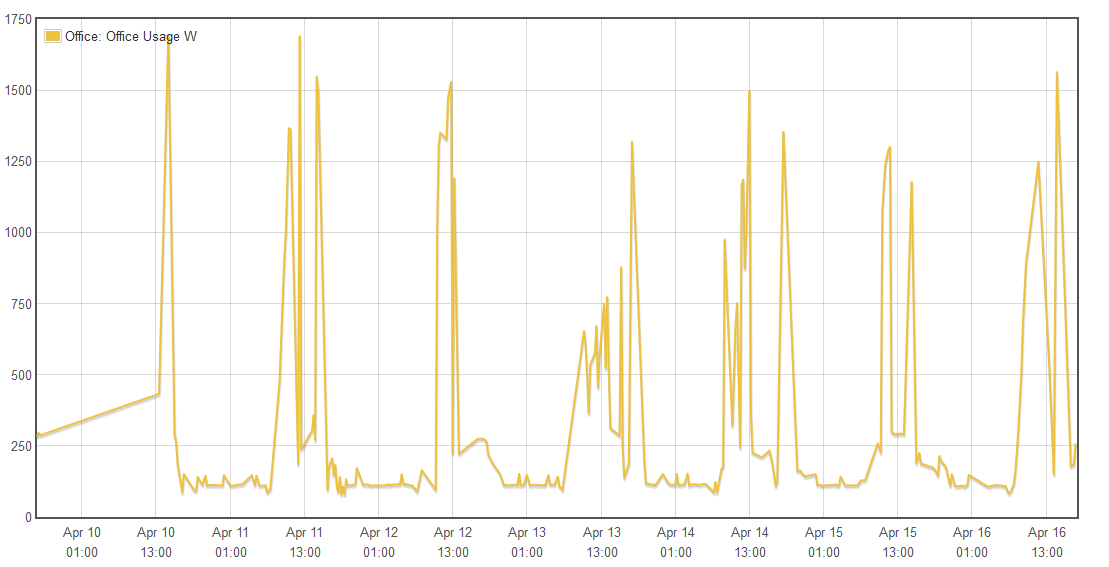
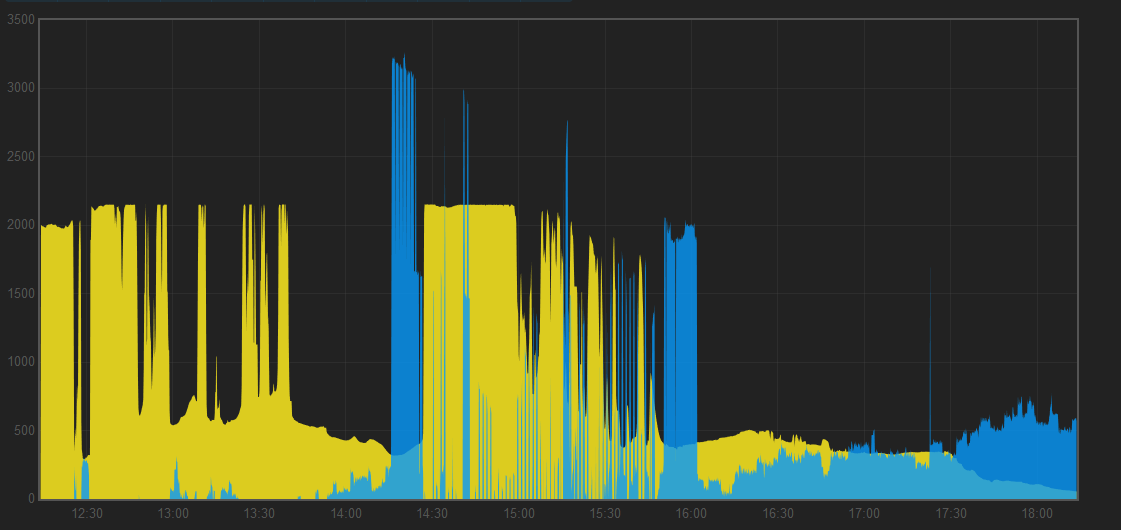
So here’s the problem I have - I’m convinced it is an emon monitoring issue - The office kW goes up as solar generation goes up.
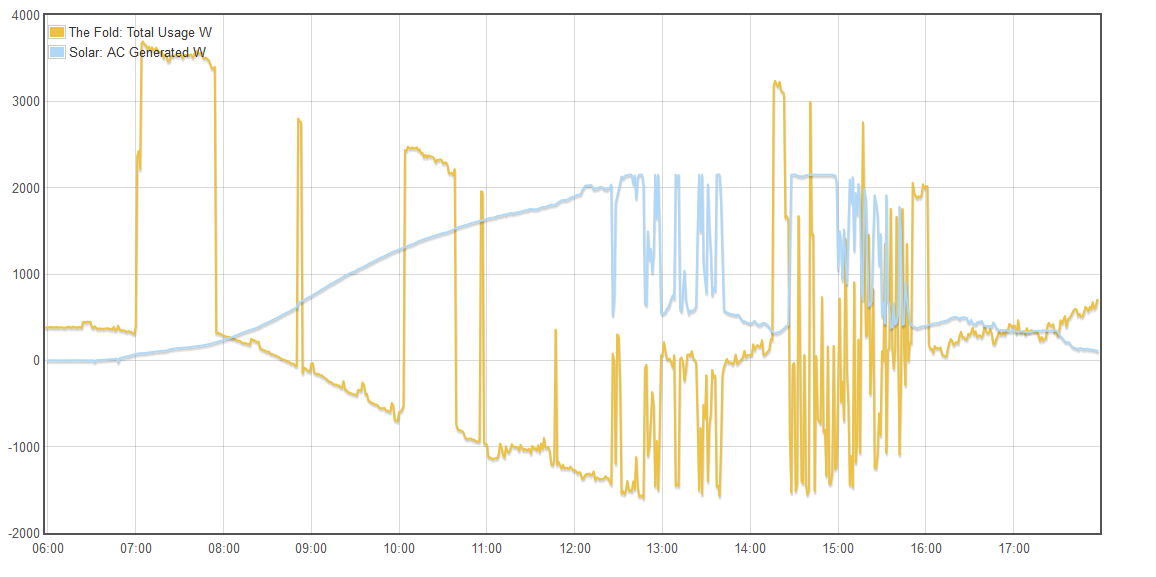
This graph is from today (however every day is the same) - as solar goes up, the office usage goes up - this isn’t really the case, there are no devices in the office that would increase usage as the solar is generated (it ticks over about 300w). Shutting the inverter off causes the office usage to drop back down to the 300w tick over.
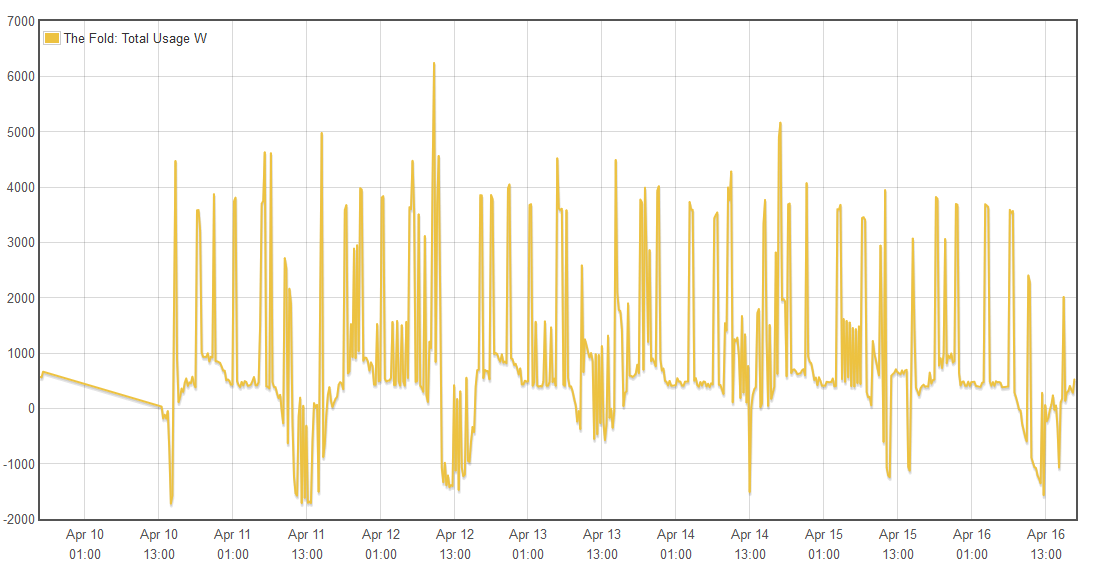
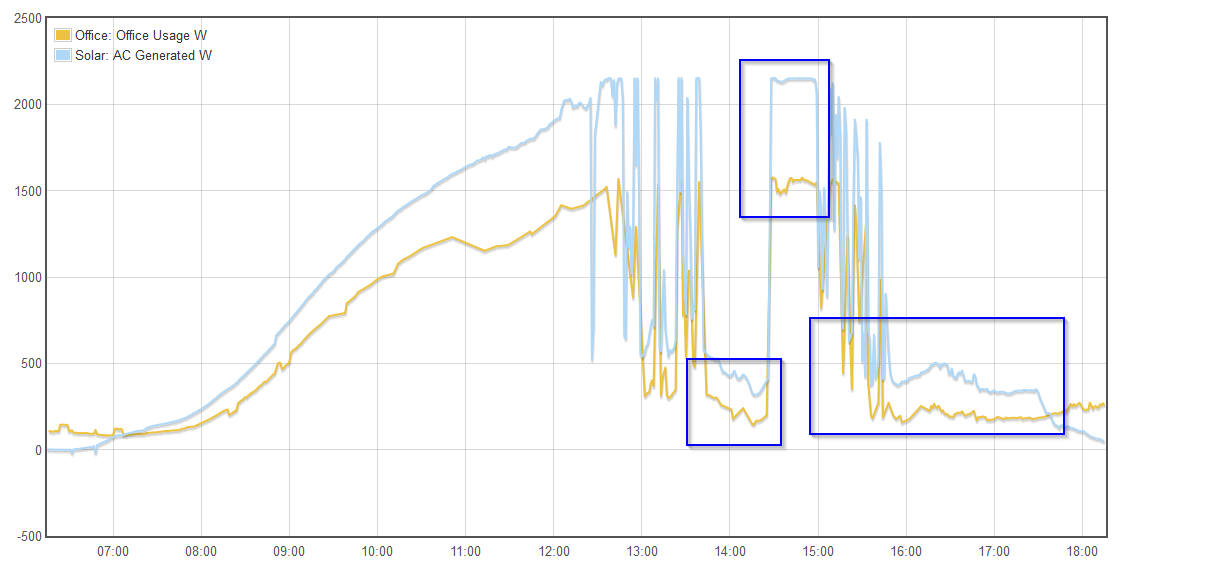
The second and third graphs higher up show the solar working as expected and feeding excess back to the grid, however this office graph doesn’t show that, it shows we use more as we generate more
The lines are almost identical in some places.
So I am convinced I’ve got either the hardware setup wrong or the software not configured quite right.
My vague idea is that CT2 on the emonTX in the house is reading the office current draw and somehow double counting the solar feed in? Not sure if that is a thing.
You do realise of course that the “Office” c.t. (emonTx - CT2) is seeing both the office consumption and the Solar output (CT1), therefore the true office consumption is the difference between those two (if both c.t.'s were facing outwards from the grid infeed)? It looks as if you’ve done that sum for the first graph, but not for the last one, where…
Without knowing any better, I’d say that is because the “Office” c.t. is the wrong way round - it is recording the Solar infeed as a positive value, when it should (according to our convention, yours might be different) be negative. The easy test is to turn off all consumption in the office while the sun is shining and the PV is generating, when CT1 & CT2 should both read the same value, but CT1 should be positive and CT2 should be negative.
You do realise of course that the “Office” c.t. (emonTx - CT2) is seeing both the office consumption and the Solar output (CT1),
Yeah, I suspected that is what was happening.
I’d say that is because the “Office” c.t. is the wrong way round - it is recording the Solar infeed as a positive value, when it should (according to our convention, yours might be different) be negative.
That makes sense. Should I be expecting to see a negative graph of “Solar Generated” if I follow convention?
As I wrote, your solution is the true office consumption is the difference - taking the signs that indicate the direction of power flow into account - between the two power values that are recorded on each side of the office.
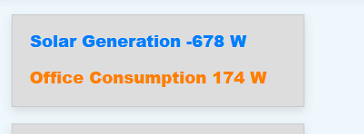
So I’ve got my solar reading negative now. I can’t get my head around that, I consider it as a positive integer -“solar watts generated”, so it makes our dashboard a little whacky
I’ll now have a play with the feeds and see if I can get Office Consumption reading zero and the whole house reading negative when we are generating more than we are using.
Normally, we regard imported power, be it from the Grid or from PV, as positive and exported as negative. The purpose of turning it round was so that you could clearly see the maths to get the PV contribution and the office use separated. You can change the sign again after you’ve done the maths and before you display it.
That’s the general concept. More to the point perhaps - get the office consumption positive when it’s consuming.