I’ve also been chatting over in heatpump about some of the improvements I’ve made to my setup as a result of using the app.
I thought it’d be a good idea to have a topic to chat about things I’m improving in the app to save me spamming the other categories and topics. I can keep the app development chatter on this topic. Obviously you should subscribe if you want to hear about the news
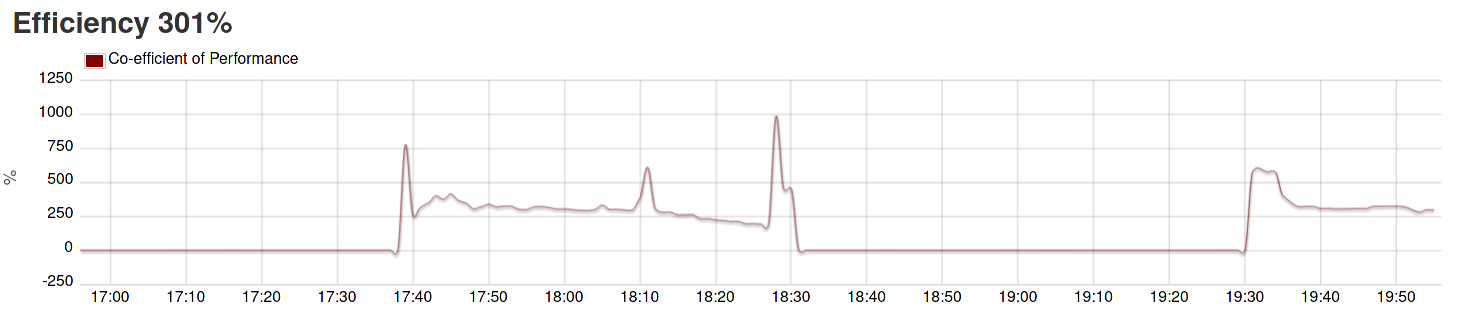
Smoothing of the CoP over a few minutes so it’s less spiky
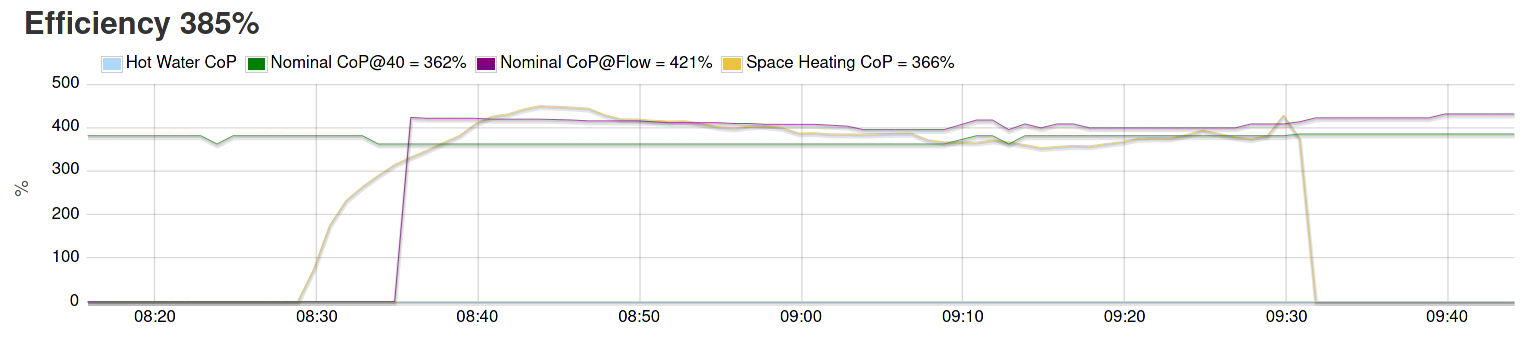
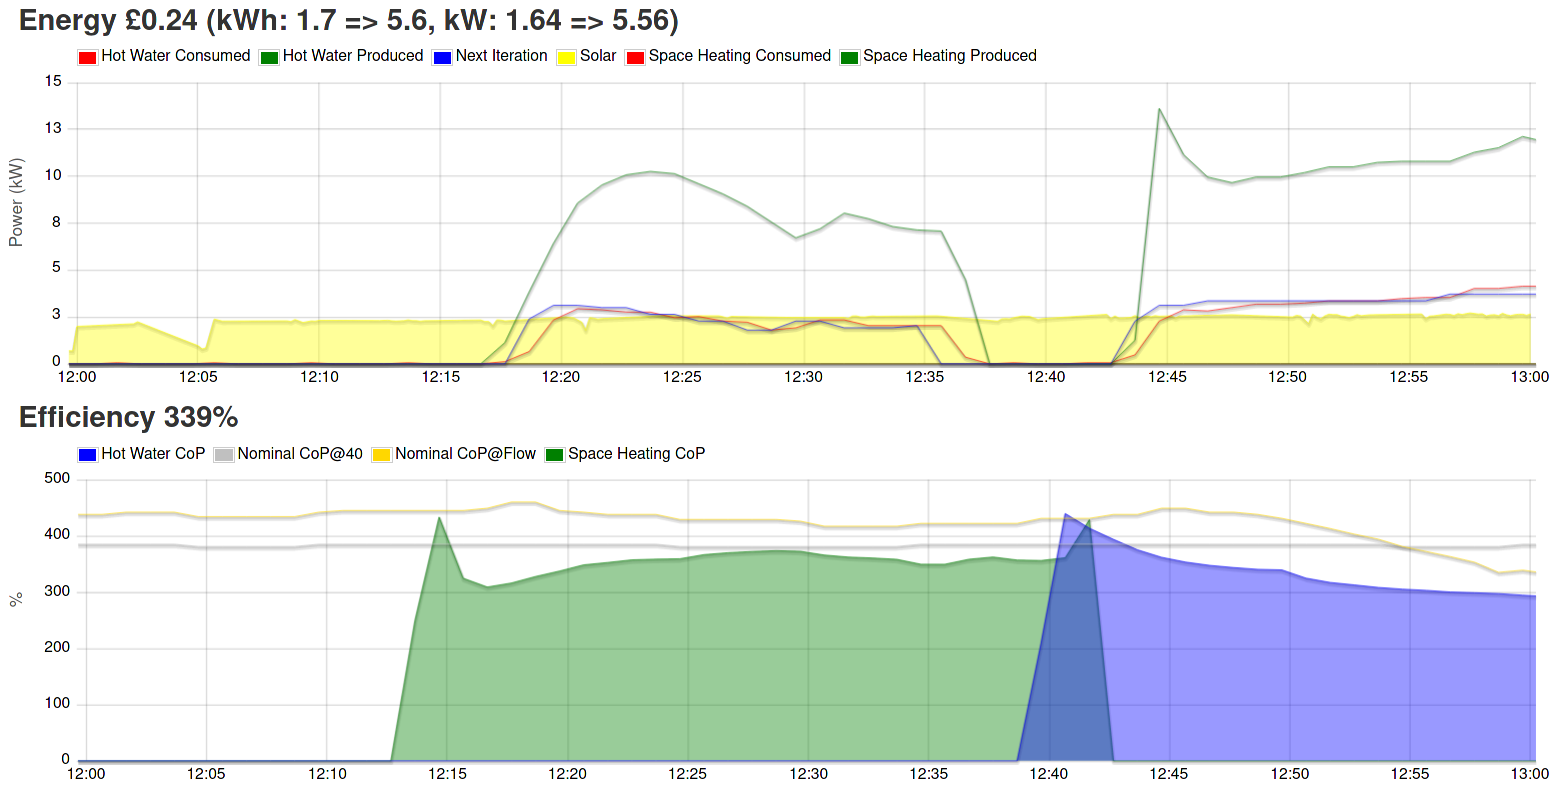
Client-side calculated CoPs are a moving average so jump around less than before. Here’s an example from before:
and then after:
As Simon says, the efficiency scale is typically much more sane now.
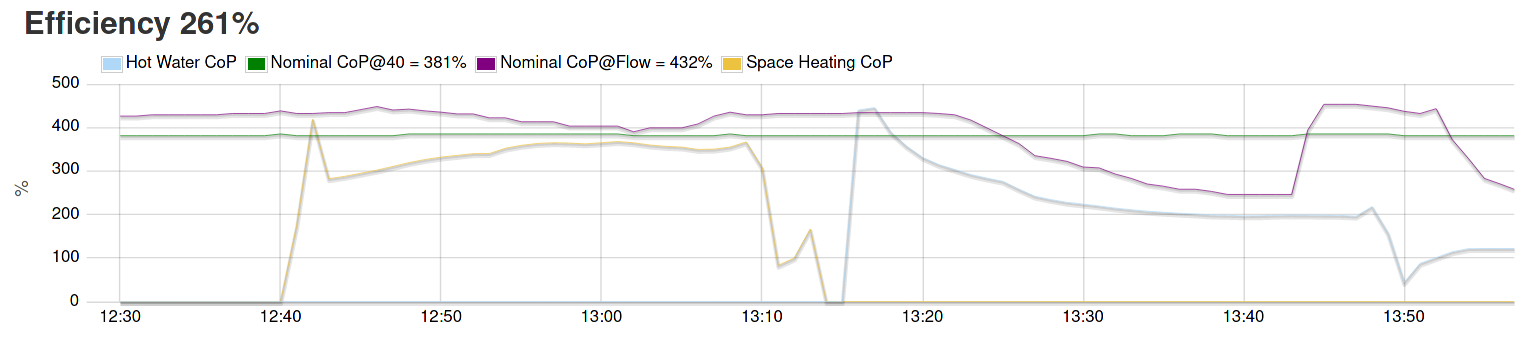
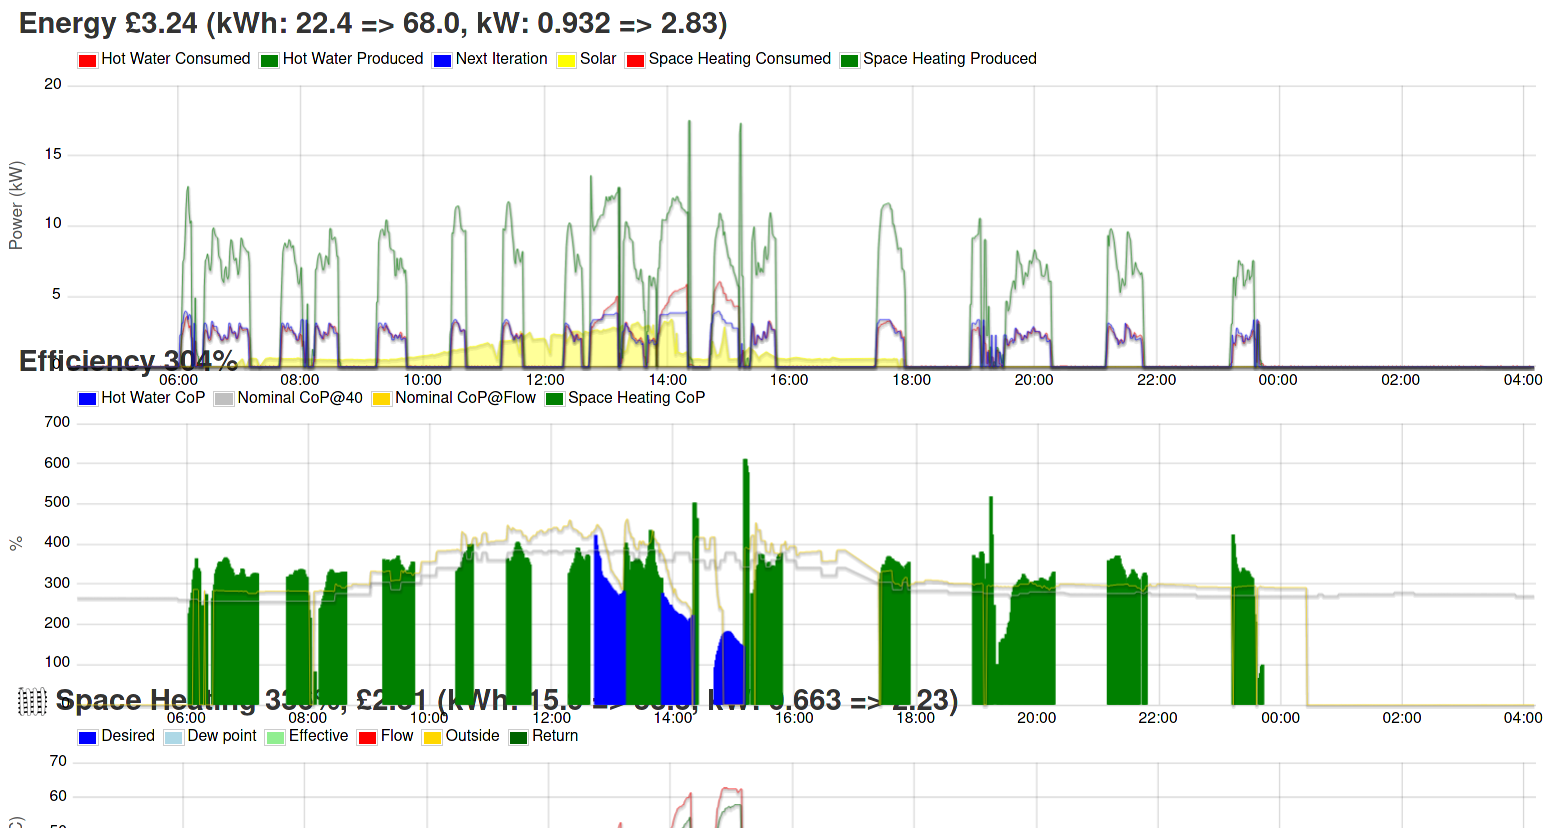
A way to show nominal efficiencies for a heat pump
Using these efficiencies from a common device we can see what the vendor expects at various combinations of flow and outside temperatures.
These are included in the Efficiency graph (if you choose to) so you can see how your actual CoPs compare.
In this example you can see we have a design flow temp of 40 °C which interestingly has a CoP of 3.62 at 6 °C but we’re averaging 3.85. Of course the graph makes it clear that we’re actually just hitting the expected CoP because we’re running at a lower flow temp than the design one.
This helps you see more clearly which things are affecting your efficiency and as you can see in this example, the water heating is going down in line with the vendor’s predicted CoP (until it hits the defrost at 13:42).
It also re-directs to the login page if the problem is related to getting to the web server route.
Technical improvements include removing fluff in the HTML and having the graph heights work more simply. I’ve also switched to using “data-” attributes for data rather than unsupported attributes.
Finally, I made charts vanish if there are no feeds so there’s a better experience for people with fewer inputs such as Trystan’s case here:
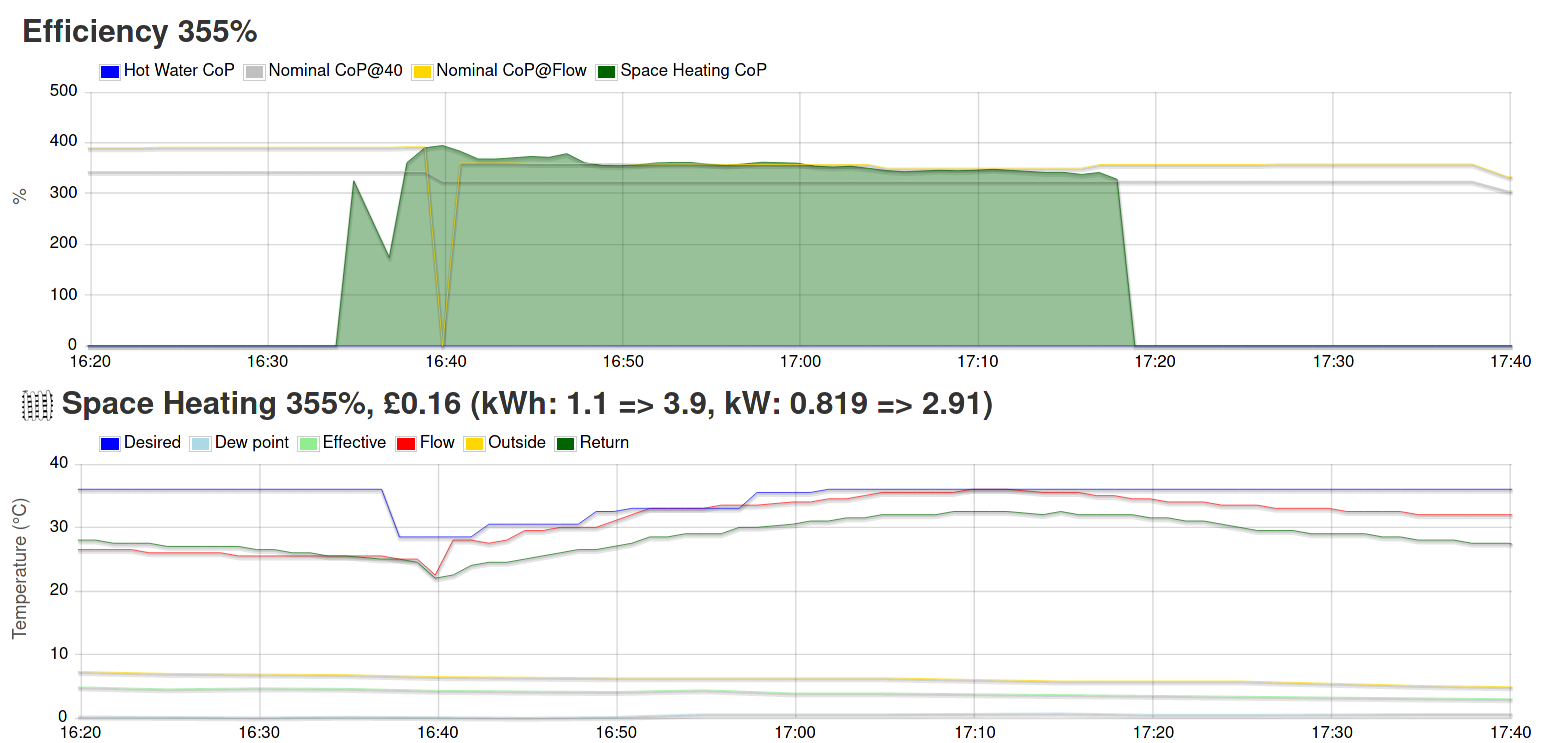
The CoP is now shown filled in so it’s easier to see, especially when space and water heating are next to each other. I did the same for solar too so it’s more clear.
BTW if you are finding this app isn’t to your liking, the one built by Trystan and John Cantor might appeal. Trystan recently made a video about it too:
Looks lovely. How can I install this, please? There doesn’t seem to be any installation instructions in the readme.md and I didn’t find an install.md or an obvious way to tell App > + New to use a git repo.
I see you are possibly a software dev. I just tried setting it up but realised I’m quite a long way from a normal setup so I’ll show you what I did and if it makes sense then do that, otherwise let me know and I’ll dig into it a bit more to remind myself what I should have already written.
If you clone the repo you’ll have a mmspheatpump folder.
The something along these lines to put it into what I believe are the right places:
Well, I have installed it and it displays something, but there is a "# EmonCMS 10.x # EmonCMS 11.x " at the top which puzzles me and the mmsp.json makes me think that I need to collect more data than I have been, including WaterPump4Status. I’m not sure if more configuration is needed to get it the feeds as it wants or if that mmsp.json sets them up?
mmsp.json will set them up in EmonCMS but you would need to POST the values after gathering them from MELCloud. As you can imagine, there’s far less useful data in MELCloud these days. The app will run with whatever you can give it. Of course if you want to setup the feeds manually that’s fine too, I just created mmsp.json to help get a solid setup.
The bit you see at the top is funny. It’s me falling foul of using too may languages, you can see the Python-style comments in the HTML here:
I have updated my script to gather the values now but how do I use mmsp.json to set up the remaining feeds? And is my node name of melcloud OK?
Scrub that. I restarted apache (I guess something was cached somewhere) and then could edit my melcloud device to be of the MyForest/MMSP ASHP type. It offered to create the feeds it did not yet have.
Two hiccups: the wrench on the web interface does nothing when clicked and the config/application-configuration.json only seems to use some Rate1 values, not the Rate2 as well. I also added RoomTemperatureZone1 to the heating chart: I know you don’t use it, but I think it’s nice to see what it does.
@mjr If you want to go crazy and send a PR for your changes I’ll see if it makes sense to merge them in, notably the RoomTemperatureZone1 change is probably useful for sensible people who have room thermostats or who benefit from the Ecodan one.
I’m not sure this is worth splitting out into a pull-request. The RoomTemperatureZone1 one is just the following added to config/application-configuration.js after TargetHCTemperatureZone1:
    "RoomTemperatureZone1": {
        "displayOptions": {
            "label": "Inside",
            "color": "purple"
        },
        "type": "feed",
        "autoname": "RoomTemperatureZone1",
        "engine": 5,
        "optional": true,
        "description": "The room temperature in Zone1 in degrees Celsius (°C)"
    },