Hi there!!
Some weeks ago I’m having problems with the graphs of accumulative kwh I have weird very big increments of energy, between feeds of about 20- 50 kwhd suddenly appear a feed of 8500Kwhd…
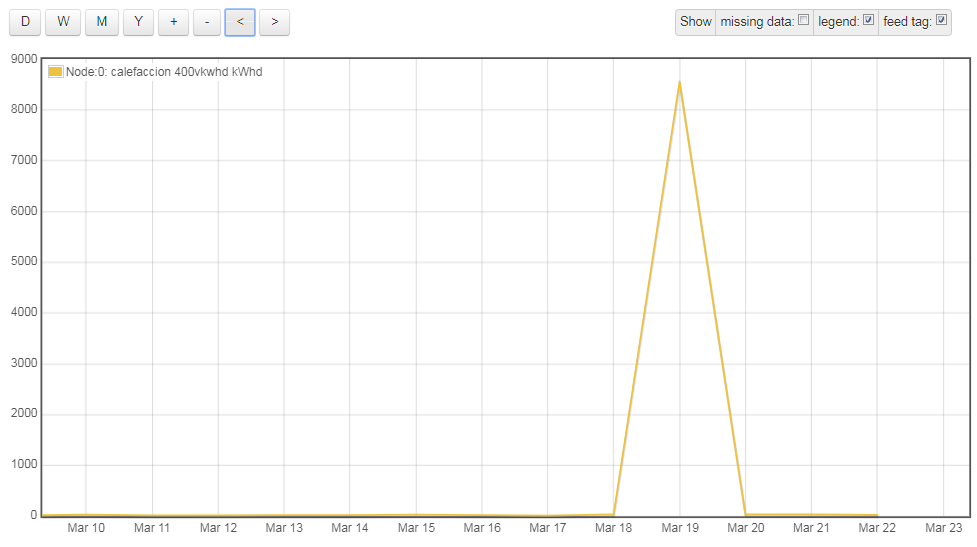
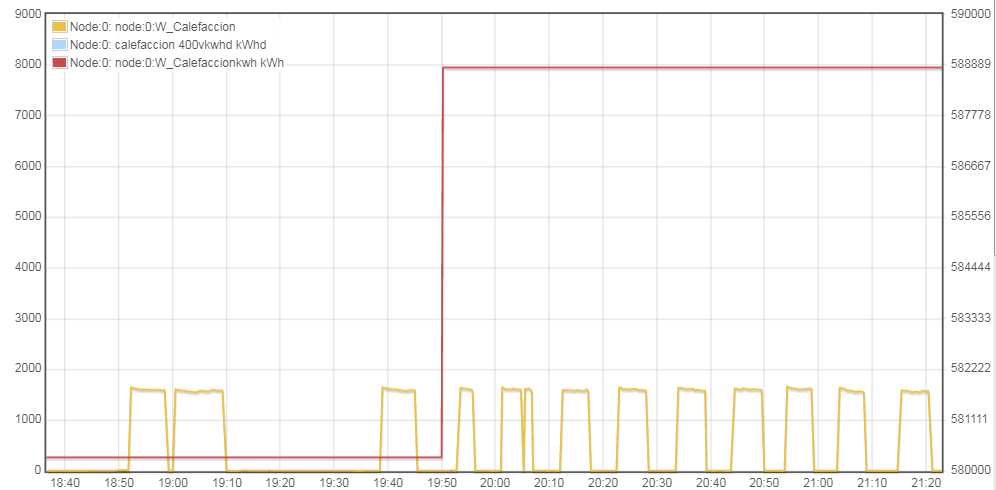
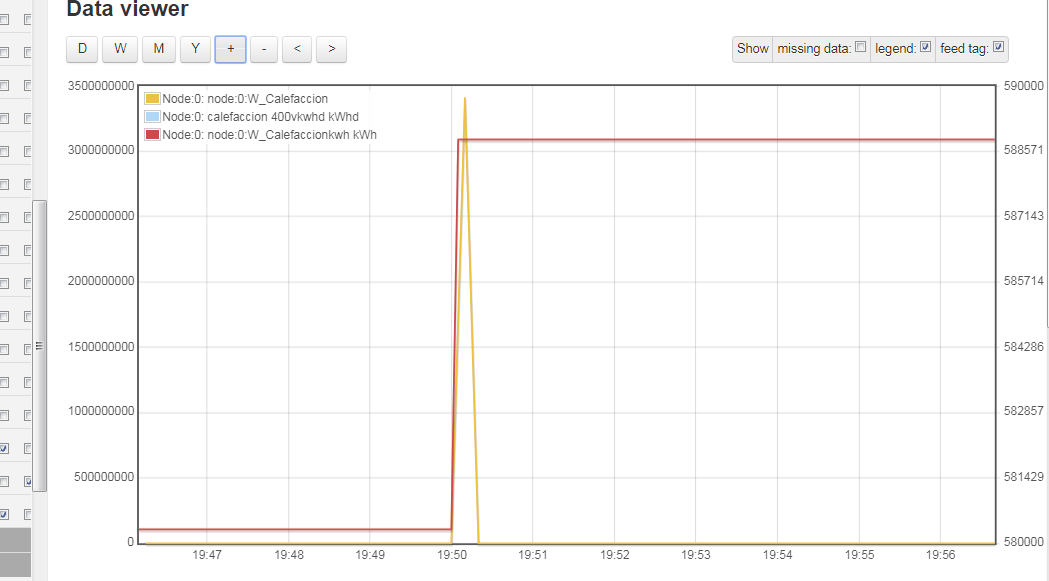
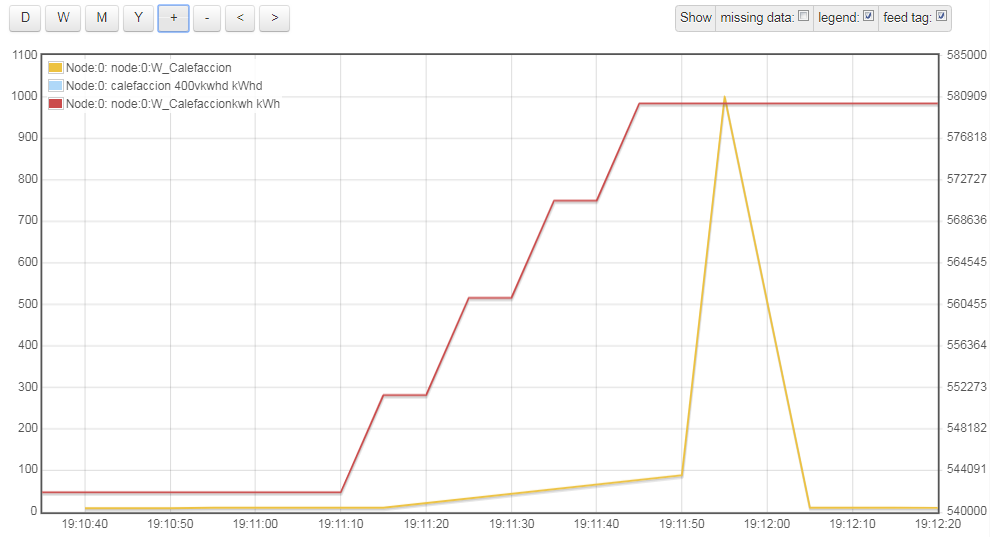
at the begining I don’t know the reason but I seek and found that this very high increments of energy are produced by a big spike of 3898348738 W of power…
in a normal graph view is not represented, but if I zoom-in the spike appear…
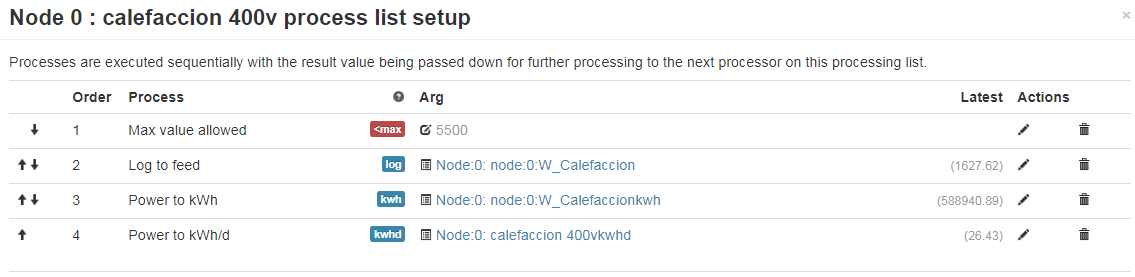
Can I put a filter, or configure a limit feed value, to ignore the readings of power, for example, greater of 10000w??
[edited]
this is happend some times ago since I begin to register the kwh
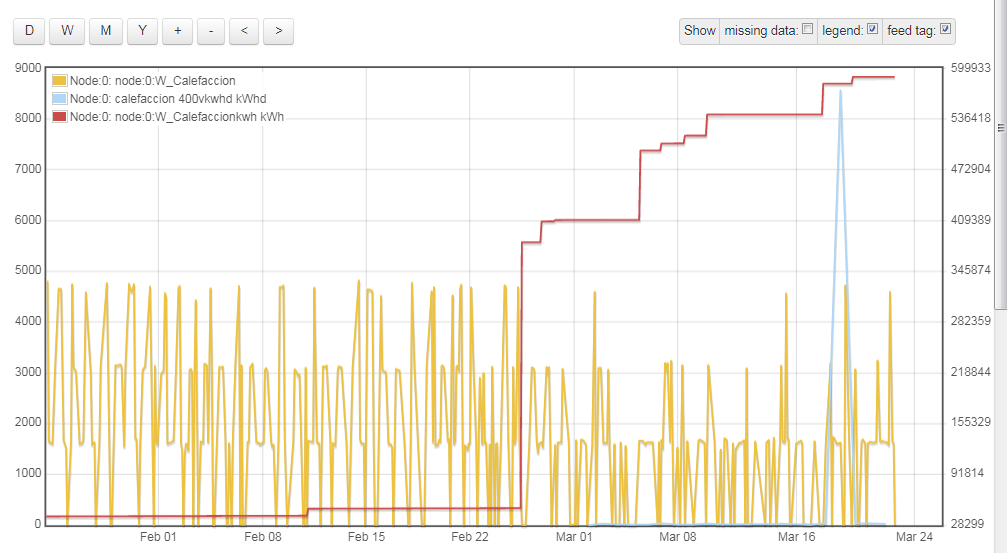
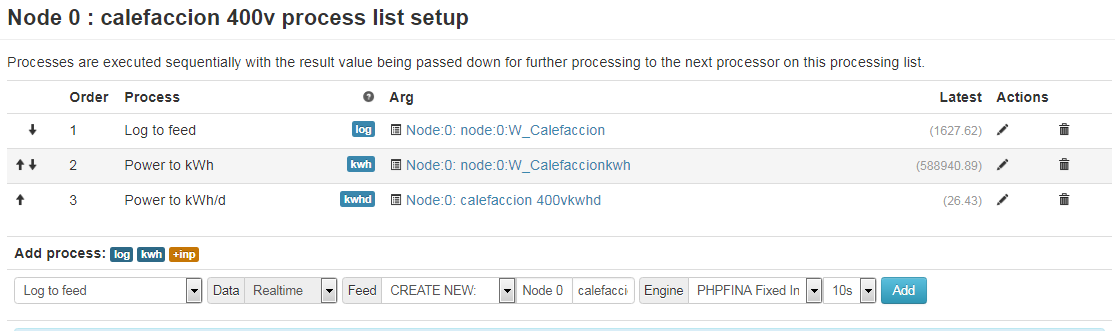
at the first times I try to solve with EditDaily function, putting a reasonable value (15kwh) in the feed … but I see that is a repetitive issue, than need a real solution, this is the reason for the blue line only have one spike…
maybe is not the only reason … in other moment I have another kwh increments without power spikes…
thanks!!
Xavi G.