I used to create a daily feed for daily values like water and electricity use.
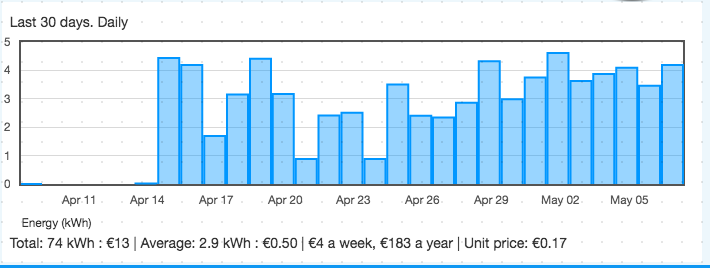
That’s no longer possible and a bar graph with the cummulative value must be used for new feeds.
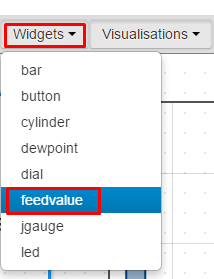
But I used to have a feedvalue widget on my dashboard showing me the water usage of the current day.
Thanks for the reply but I mean a feedvalue widget (just one value, no bar graph or a chart).
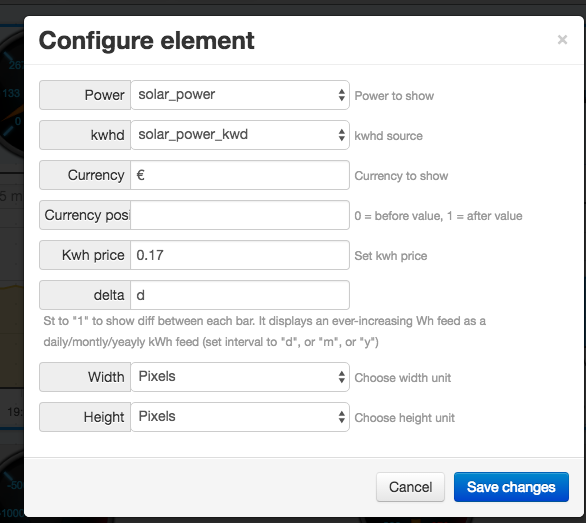
It used to be possible to create a daily feed.
Using this feed in the feedvalue widget on a dashboard showed only de daily usage of the current day.
But since you can’t create a feed with daily values anymore I can’t create a daily feedvalue anymore.