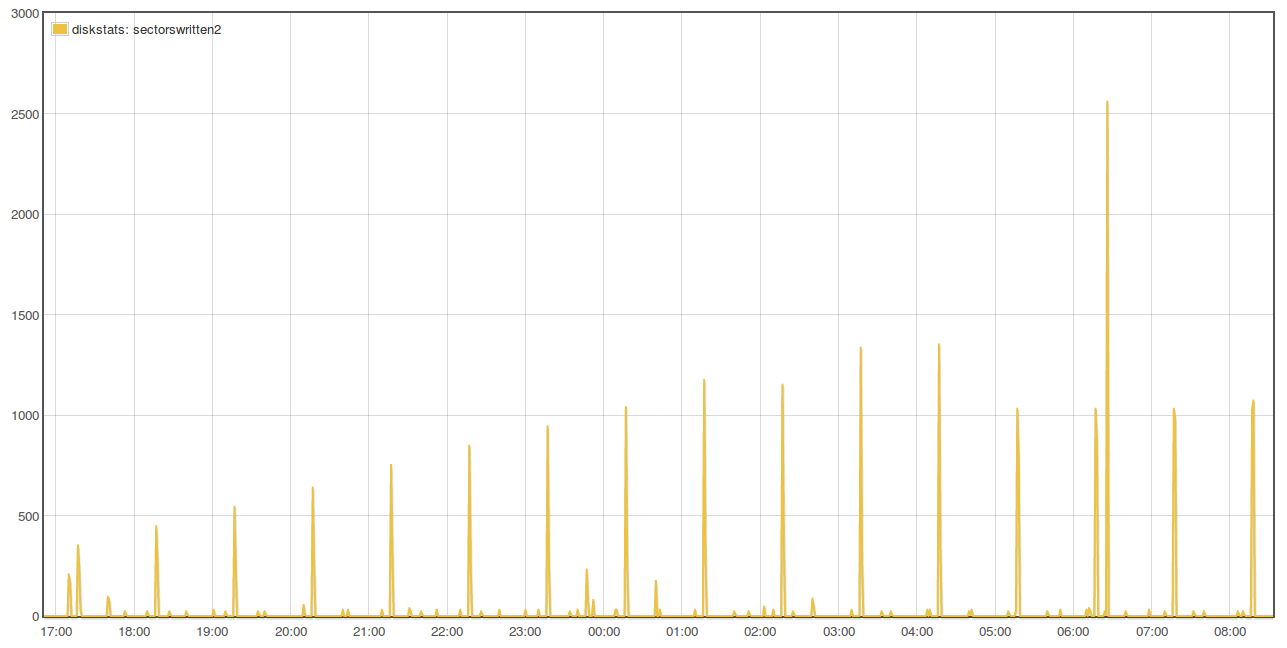
Mean sector writer per minute 321 = 2.7 kb/s, this included the feedwriter logging that I disabled for the above two tests, emonhub at ‘warning’ level with quite a few decoder match errors filling the log and I had not cleared the logs. So its not really a relevant comparison but useful to understand what kind of magnitude the write load can get too.
It seems that even with rsync enabled the log2ram sync write load keeps escalating, while I would have thought it should have reduced the size of the write to the relevant difference in the log file…
I will try log2ram again next but with rsync disabled.
@TrystanLea
Ah! - if I’ve understood correctly …
The 4 bytes vs 9 bytes / phpfina vs phptimeseries is irrelevant - it just affects the amount of ‘waste’ in the 1024 block.
And that would be true up to 113 (1024/9) datapoints per block write.
So if posting every 10 secs, that would mean buffering and only writing every 18 mins (113*10/60) or thereabouts in order to eliminate ‘waste’.
Thx
Ok. The issue then is that it is not just emonhub log entries saved in daemon.log - all services default to writing log entries to that file.
I’ve developed a mechanism to isolate the emonhub log entries here emonSD next steps: emonhub logging which might be worth investigating.
Can you explain what you mean here?
One of the problems is the rate of logging fills the logs. For emonhub at least, I don’t think there is an appetite to reduce the granularity, just a means of managing it. I also think we need to cater for worst case i.e. maximum logging.
Do you mean the write speed i.e. writes per second or the number of actual writes in a second? Probably the latter but just to be sure, as it is (of course) the number of writes that happen, not how quickly they happen.
Whats not quite clear to me yet is how much less write load log2ram with an hourly sync is resulting in vs logging straight to the SD card in the first place and what the difference is between rsync enabled or disabled. That’s what Im trying to test at the moment. Im testing a reduced logging configuration but the results should maintain similar proportions if logging was more granular… although that would also be good to confirm with testing
I would be surprised if there is any real advantage using rsync over cp. In general rsync only offers an advantage if there are large files (>GB) and/or remote targets. The small files in play here on a local device I expect to be at a disadvantage using rsync due to the additional processing to calculate.
That may be true, however whilst you are working at such a macro level, but still with the same size sectors and blocks the differences are going to be that much harder to detect and/or measure. Ideally you should be over logging so that the differences are obvious. If it were me, I would write a small program to log dummy data to a handful of log files at such a rapid rate as to make any other un-controlled activity negligible and therefore all tests are comparable. It would speed up the tests, make the tests more consistent and the results more obvious. Doing it this way also stress tests things at the same time.
[edit] the results of your tests above seem to show L2R at least halves the write activity if I’m reading correctly. Half the wear means twice the life span, what are your aims?
The fact you see so much reduction when generating so few log messages is outstanding IMO, that effectiveness can only get better with more traffic, there is only so far you can reduce “barely writing” down to. With larger writes there would be more to save.
My understanding was that rsync transfered only the content of the file that had changed rather than copying the file anew. rsync - Wikipedia I guess it depends what the chunk size is which isnt entirely clear?
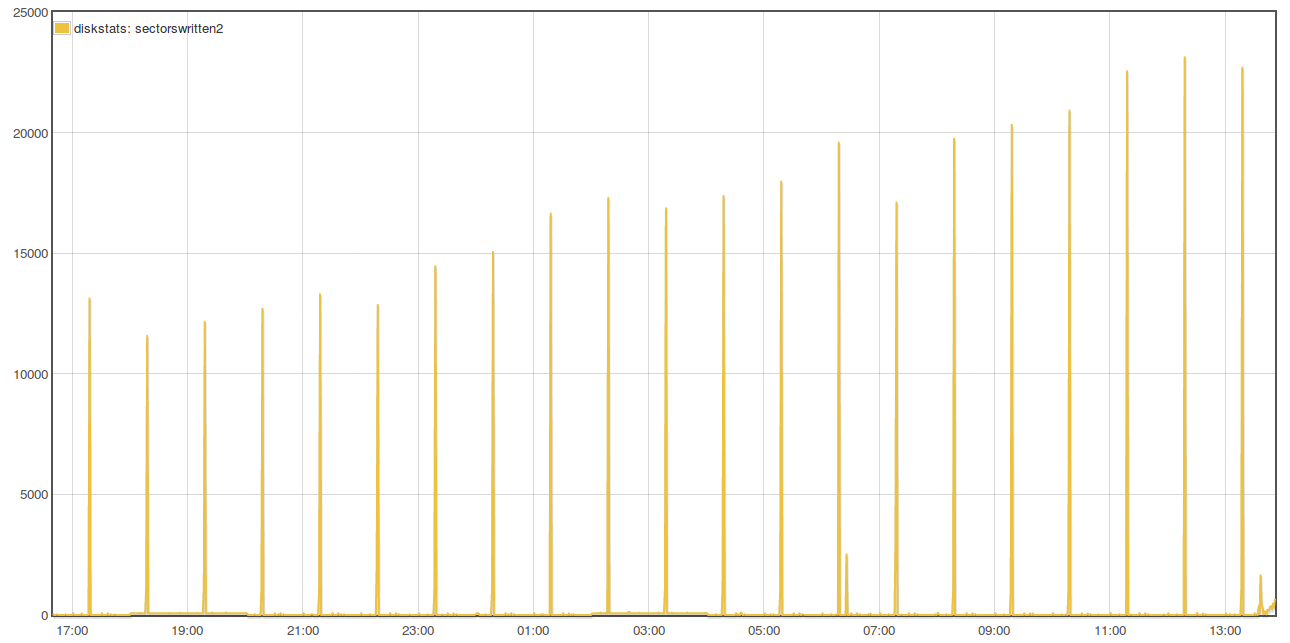
The test showing half the writes is for logs starting from a cleared state. As the log file size increases it appears the size of the hourly sync spike increase as well, the question is does it start becoming a larger write load than direct writes after x number of days, or with a lower logging resolution, that is what is not entirely clear to me…
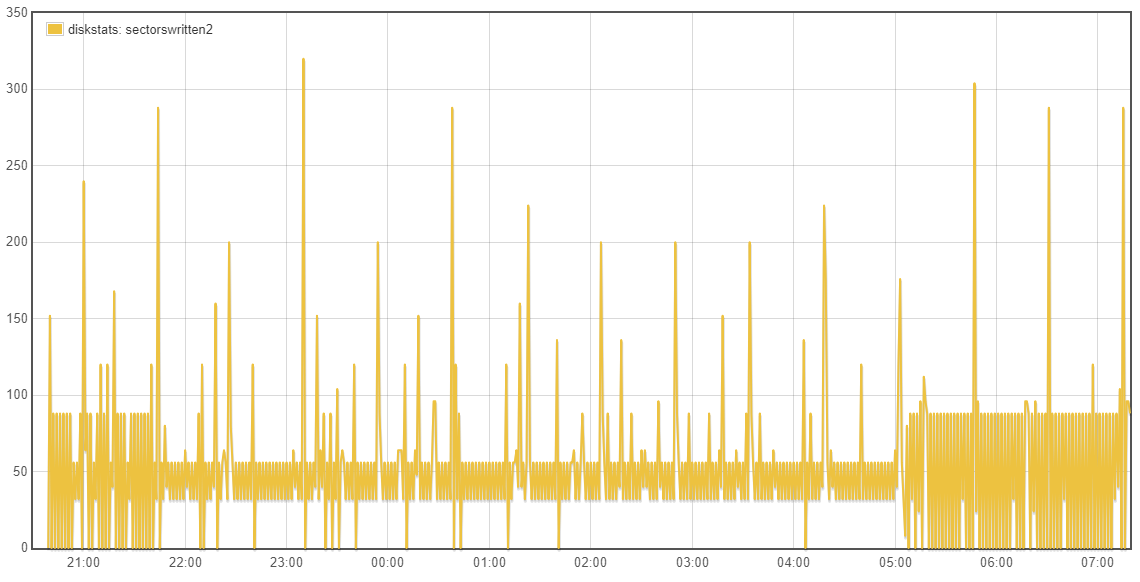
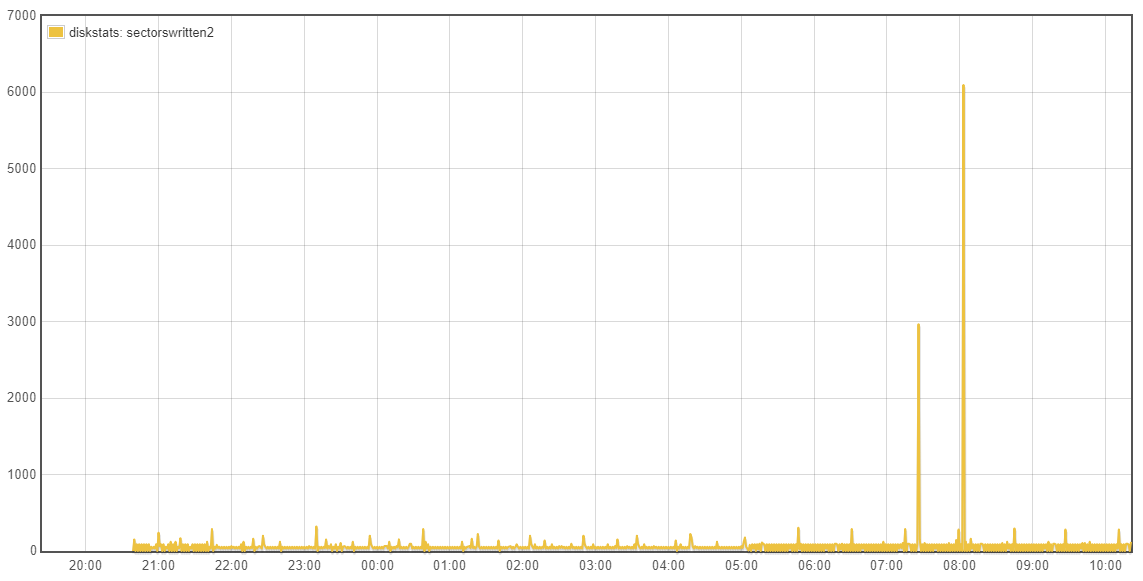
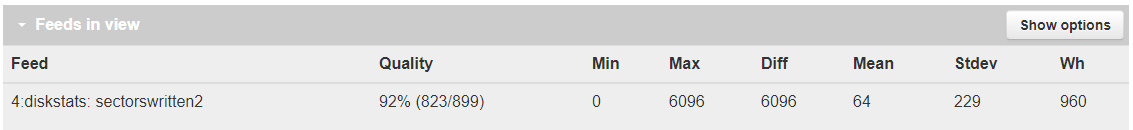
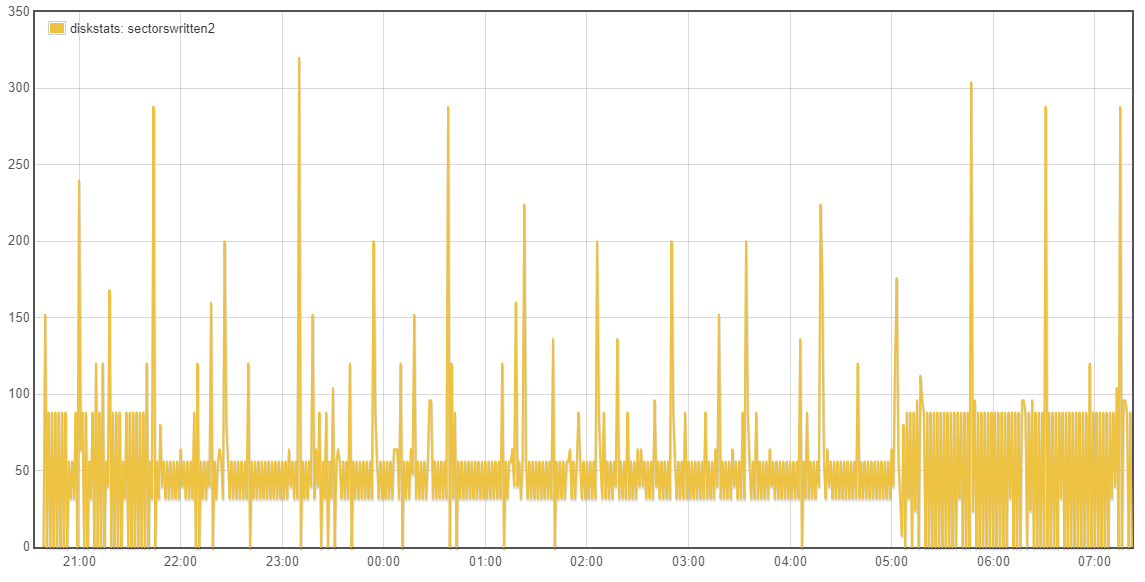
The write rate from 9pm to 6am not including the large spike just before 7am was 20.8 or 0.17kb/s, from 7am until 5:30pm this evening it was 36.4 or 0.3 kb/s, the spike magnitude stepped down a little after midday today before continuing an upwards trend. Still not really enough data to be sure what the longer term implications are. It would be good to have 3-4 days at least.
yes that would be good as well, i was keen to test a reduced logging level to see what kind of write rate having the emoncms and emonhub logging at ‘error’ entails. I’d be grateful for any help replicating the above logs on different configurations. Do you see your sector writes per minute continue to increase over time?
Ideally the sync step should only copy the new data and not overwrite the entire file every time?..
Sure, here’s the script Im using to record /proc/diskstats:
<?php
$apikey = "";
$host = "http://localhost/emoncms";

$redis = new Redis();
$redis->connect("localhost");

// Retrieve last value from redis
$last_sectors_written2 = $redis->get("diskstats:sectorswritten:2");
// Fetch current value
$total_sectors_written2 = exec("sudo awk '/mmcblk0p2/ {print $10}' /proc/diskstats");
// Save current value to redis
$redis->set("diskstats:sectorswritten:2",$total_sectors_written2);
// Calculate difference
$sectors_written2 = $total_sectors_written2 - $last_sectors_written2;

// Retrieve last value from redis
$last_sectors_written3 = $redis->get("diskstats:sectorswritten:3");
// Fetch current value
$total_sectors_written3 = exec("sudo awk '/mmcblk0p3/ {print $10}' /proc/diskstats");
// Save current value to redis
$redis->set("diskstats:sectorswritten:3",$total_sectors_written3);
// Calculate difference
$sectors_written3 = $total_sectors_written3 - $last_sectors_written3;

// Send to emoncms
file_get_contents("$host/input/post?node=diskstats&data=totalsectorswritten2:$total_sectors_written2,sectorswritten2:$sectors_written2,totalsectorswritten3:$total_sectors_written3,sectorswritten3:$sectors_written3&apikey=$apikey");
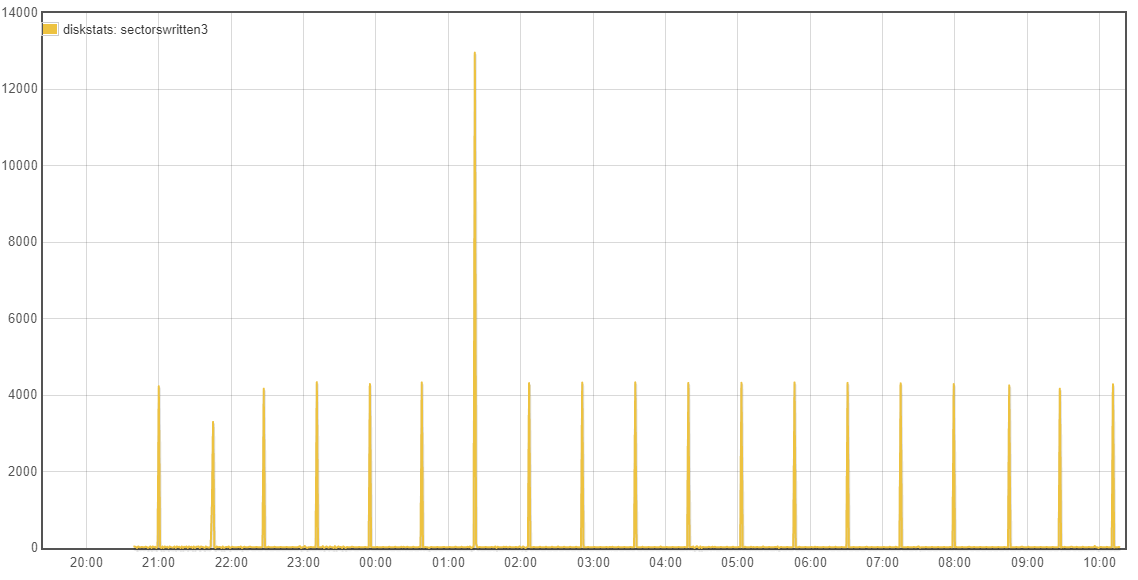
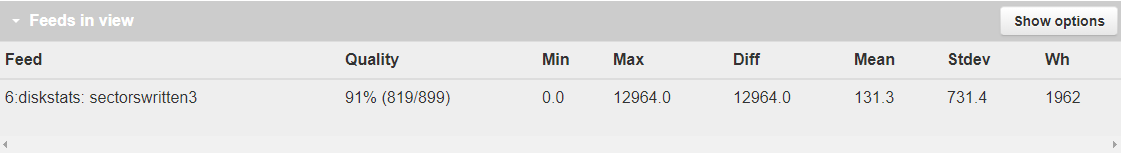
The trend is still increasing, average from the start is now 47.2 sectors/minute 0.4kb/s, the last 6 hours 72.7 sectors/minute 0.6 kb/s (higher than the write rate logging direct to disk of 0.54 kb/s). The /var/log folder size itself is now 2.1mb (increased at 0.014 kb/s for last 15 hours, the same rate as in the 12h15 period posted above).
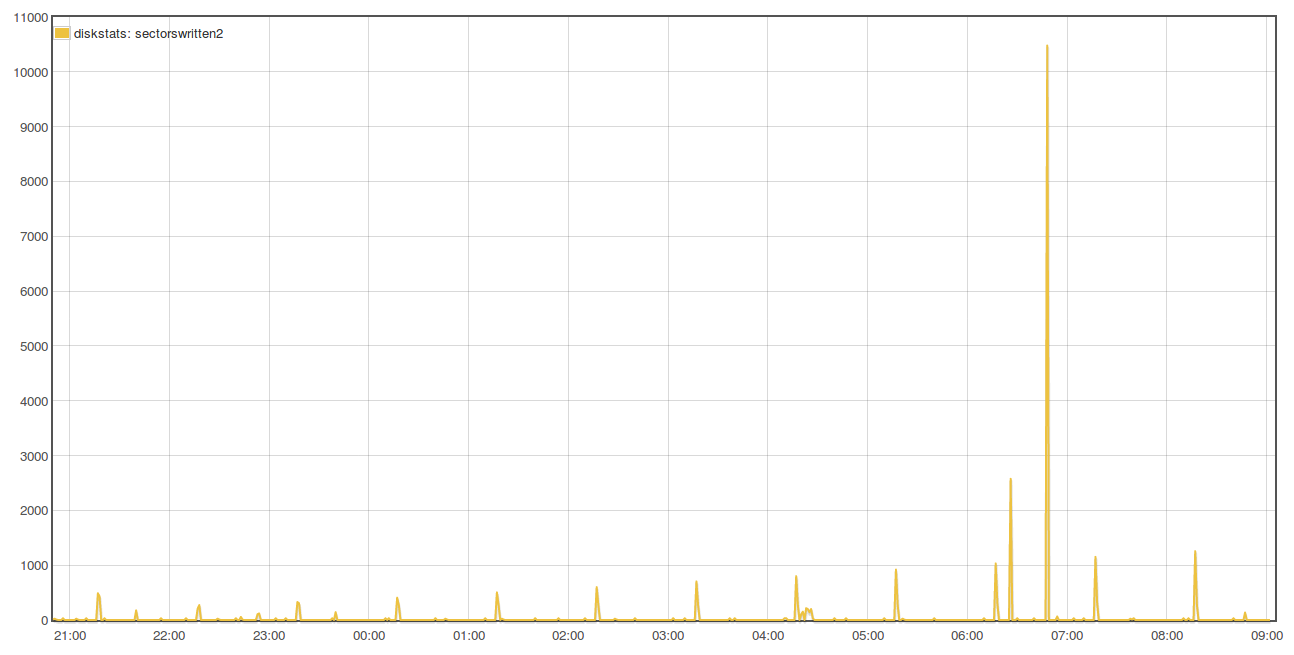
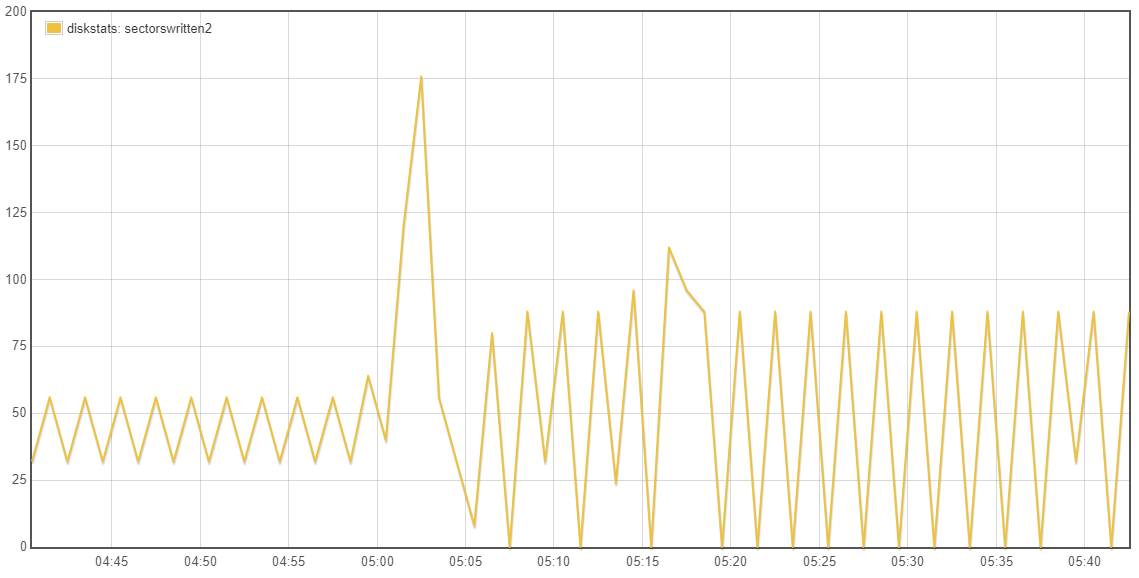
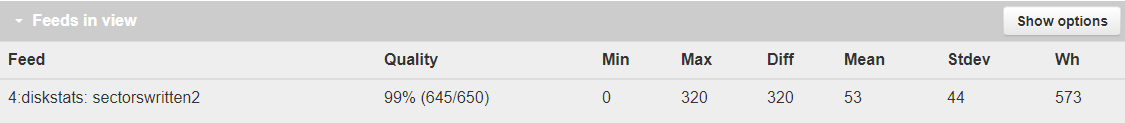
I ran these stats overnight. Running a standard EmonSD on an EmonPi with just a CT but picking up RF from my other setup. Using the modified emonhub logging as mentioned elsewhere. emonSD next steps: emonhub logging - #13 by borpin
What might be interesting is plotting where feedwriter is writing and what volume. I cannot explain why for some parts of the period the minimum was not zero then from 05:00 it was (not me guv!)! The spike is probably a logrotate of emonhub log. Could it be feedwriter is not exactly 60s?
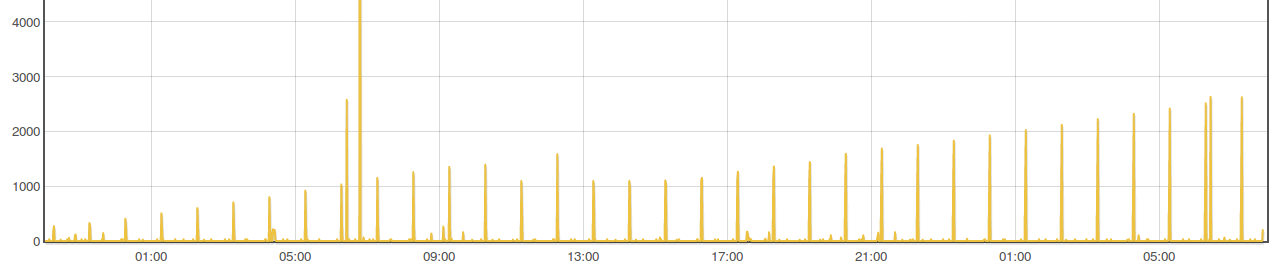
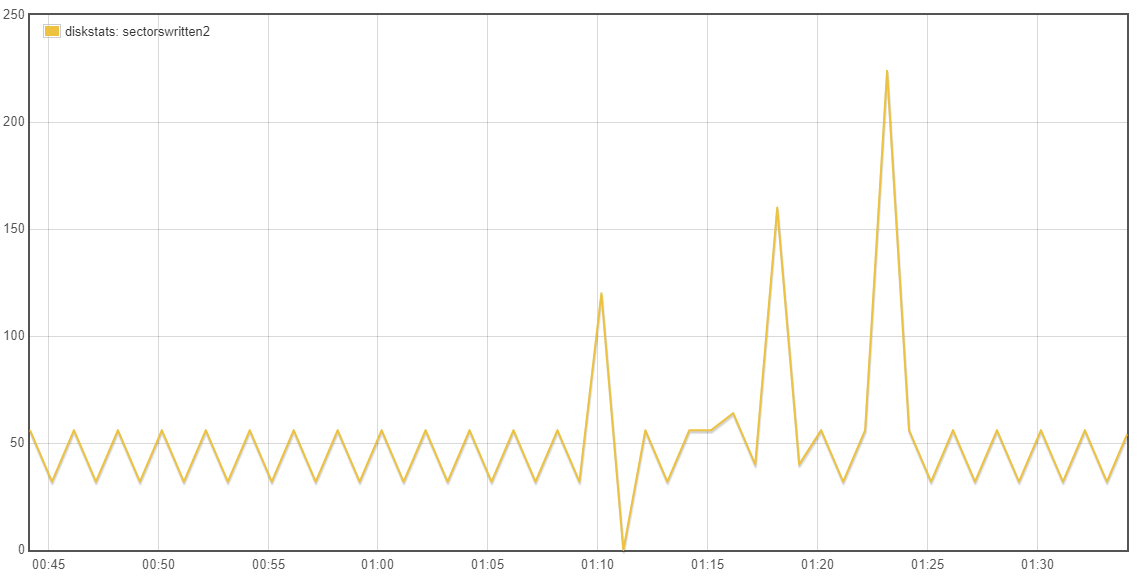
A close up of the writes as a result of the logrotation at midnight UTC. It was 3 stage rotation, concatination of latest log, a 1.gz file rotated to 2.gz and a new 1.gz file created. [edit]Log compression is about 10:1 - first compressed log was not 24Hrs