My kWhd bar charts span 2 days (12:00 to 12:00). How can I change this to 00:00 to 00:00 (24 hours on same day).

I think this is because you are viewing it at 12:00 (I’m guessing - 4hrs ago 16:00 now).
I am not sure you can fix the graphs to start at a specific time. They will display the time period set when you last saved it.
But surely a kWhd should be measured during 1 day not over 24Hrs spread over 2 days?
Sorry can’t help it “don’t call me Shirley” - you might or might not get it… hint
Yes it should. The colours make it difficult to work out which feed you are referring to. If you could change some of the reds to a different colour it may help.
Do you have the MyElectric App installed (not sure what your hardware is)? if so, what does that say?
1 Like
The MyElectric app shows the correct figure
Ignoring the colours of the rectangular kWhd boxes at the bottom of the line graph all boxes start at 12:00 on any given day & end 24 hours later at 12:00 the next day.
I use emonGLCD & emoncms to display daily grid costings so I’d just like to get them to show ‘true’ kWhd readings
I know that we’re measuring kWh over a 24 hour period but that’s not a kWhd because it’s taking data from part of 2 consecutive days or am I being pedantic:slightly_smiling_face:
I think this item may help.
I am guessing you have one of the older setups as you refer to the emonGLCD. I think there was another thread on the emonGLCD recently you may want to look for.
Thanks, I read through that guide before but it doesn’t help
@TrystanLea or @glyn.hudson will be your best bet.
I’m assuming that you have checked your timzones (for the RPi or whatever you are using and the user profile timezone?
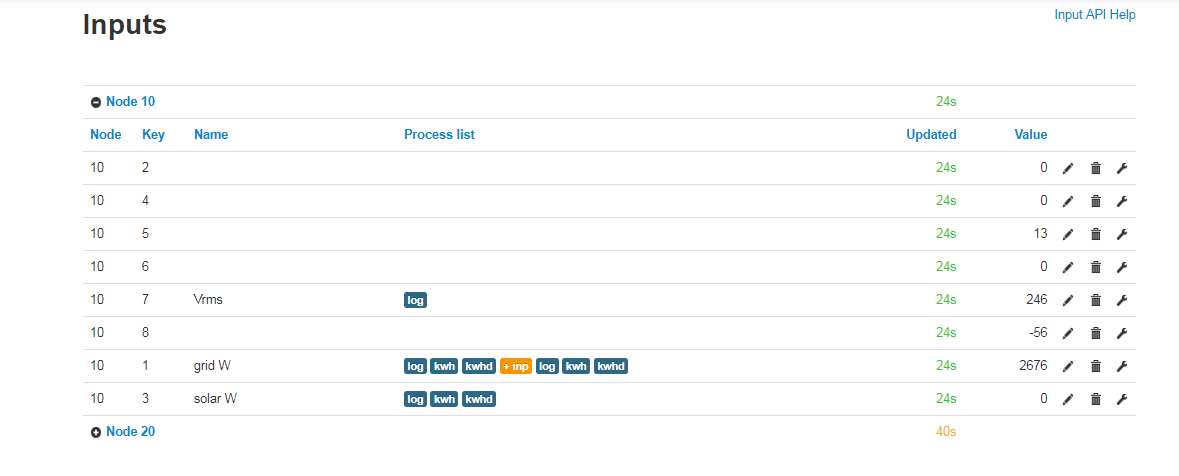
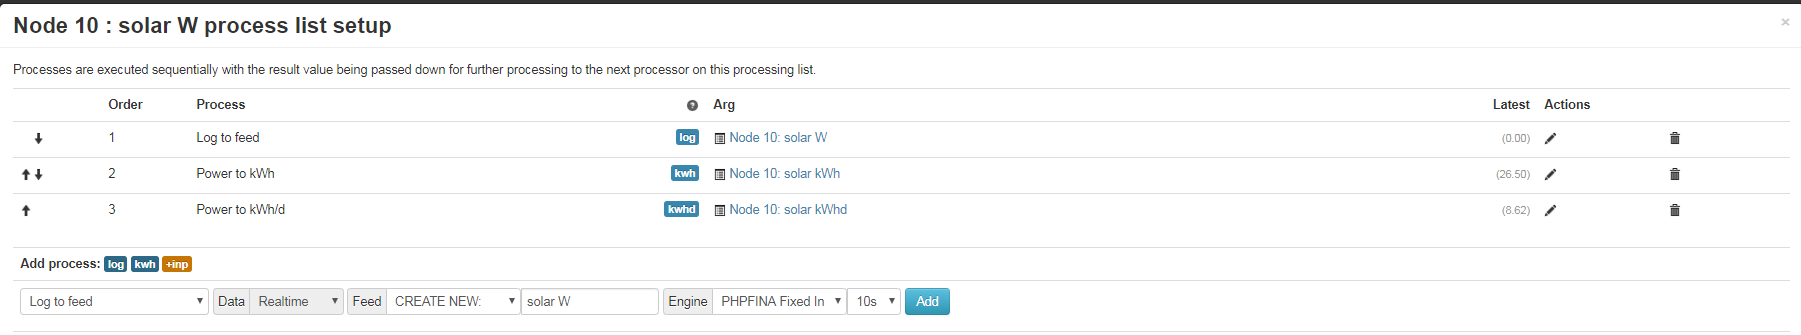
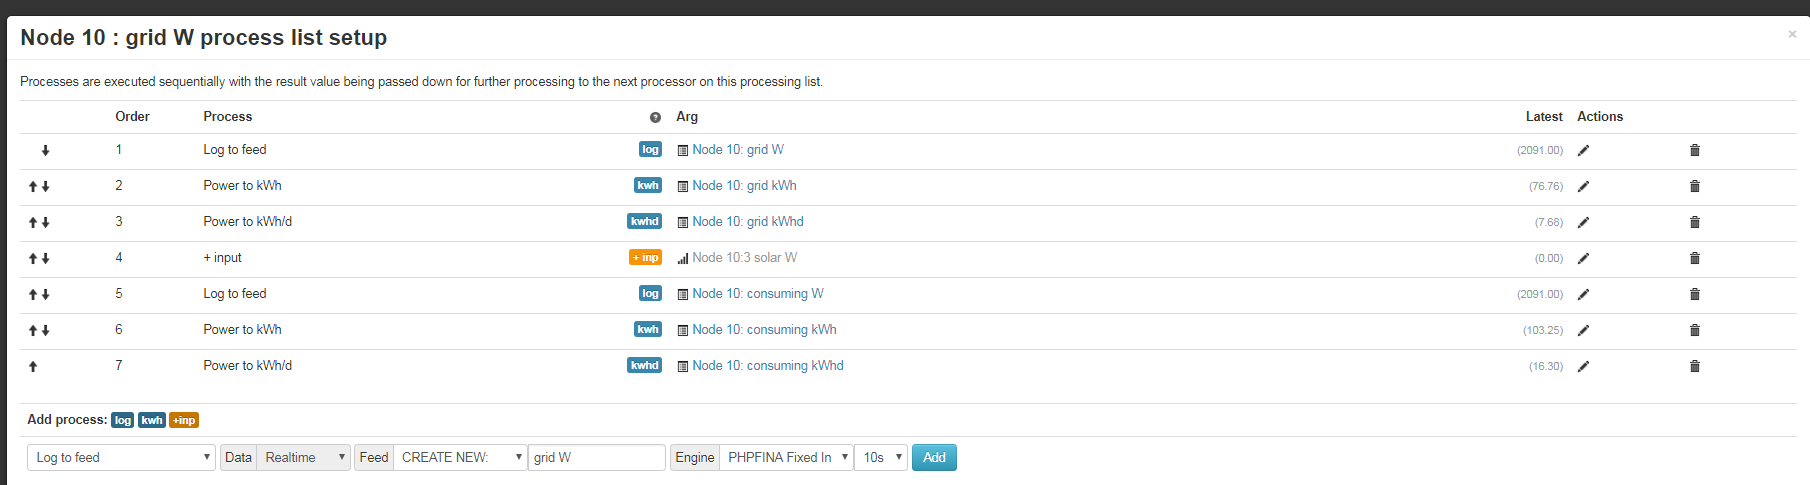
[edit] What processes are you using to get those feeds?
Yes, checked use profile & emonBasePi time zones, all OK. All emonTx data seems to be OK it’s just the display of kWhd that seems odd.
Is it the way the kWhd bar is centered at midnight that you are referring too? I think the issue is here that the graphs are not designed for showing both the power data and the kWH/d data at the same time. The bars centered at midnight is actually by design, it makes sense in my opinion when you only have the kWh data on the graph but I can understand that it does not make sense when you have both data types on there.
1 Like
What is the actual period the data shown in the kWh bars is gathered over? The display of the bar should match that period. I think that underlies Chris’s point.
Yes, the actual period is the expected period e.g midnight to midnight. If you display the bar centred at 12 noon it looks strange on bar graph only graphs. I guess ideally there would be a selectable option for personal preference…
Surely the display should always match the collection period?
I agree with that
Yes, it doesn’t make sense to have 00:00 to 00:00 data centred at 00:00
Can you give an example of a graph with 00:00-24:00 bars centred at 12:00 that looks strange?
This is an example of why I selected centred on midnight:
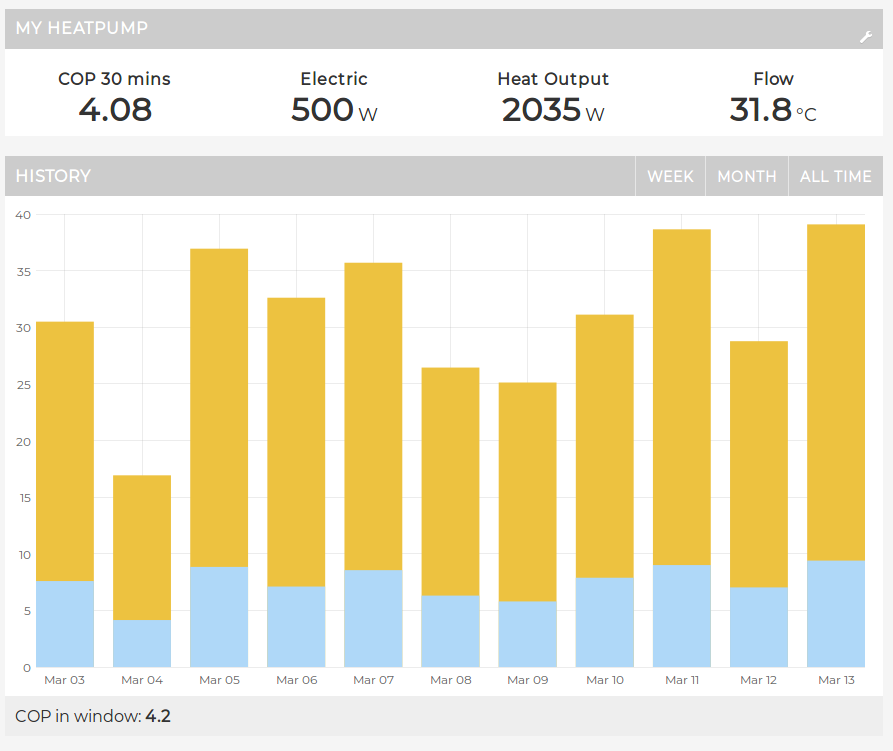
The text for the day is aligned to the centre of the bar. When its left aligned the date is centred with the gap between the bars…
Ah, I’m running the fix to flot that I posted a while ago so mine looks like the graph below:
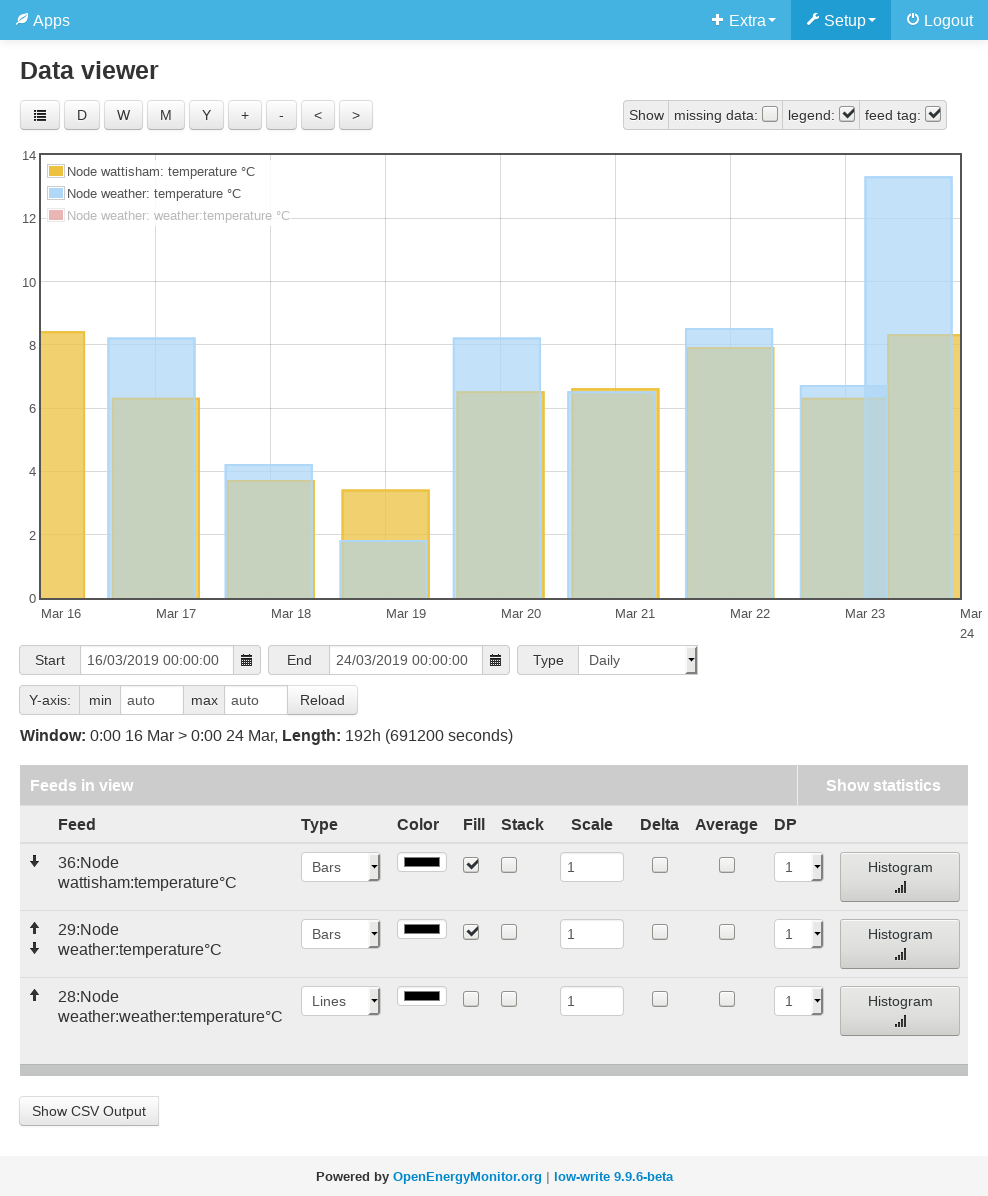
It would look fine with the bars centred at 12:00. Though I agree some specific code would be needed to make it ultra-pretty. Incidentally, why don’t my two sets of bars line up timewise exactly?
1 Like
I will look at you proposed code changes again, not sure why they are not aligned, can you give more context on the feeds?
The blue feed is quarter-hourly; the yellow one is hourly. Both are phptimeseries.
edit: the blue one typically has periods overnight when there are no readings (I think the source shuts down). Is it setting the times of the bars from the observed data rather than the requested period perhaps?