Using emoncms 10.2.3 I have a probe that reports a temperature which is stored as PHPFINA.
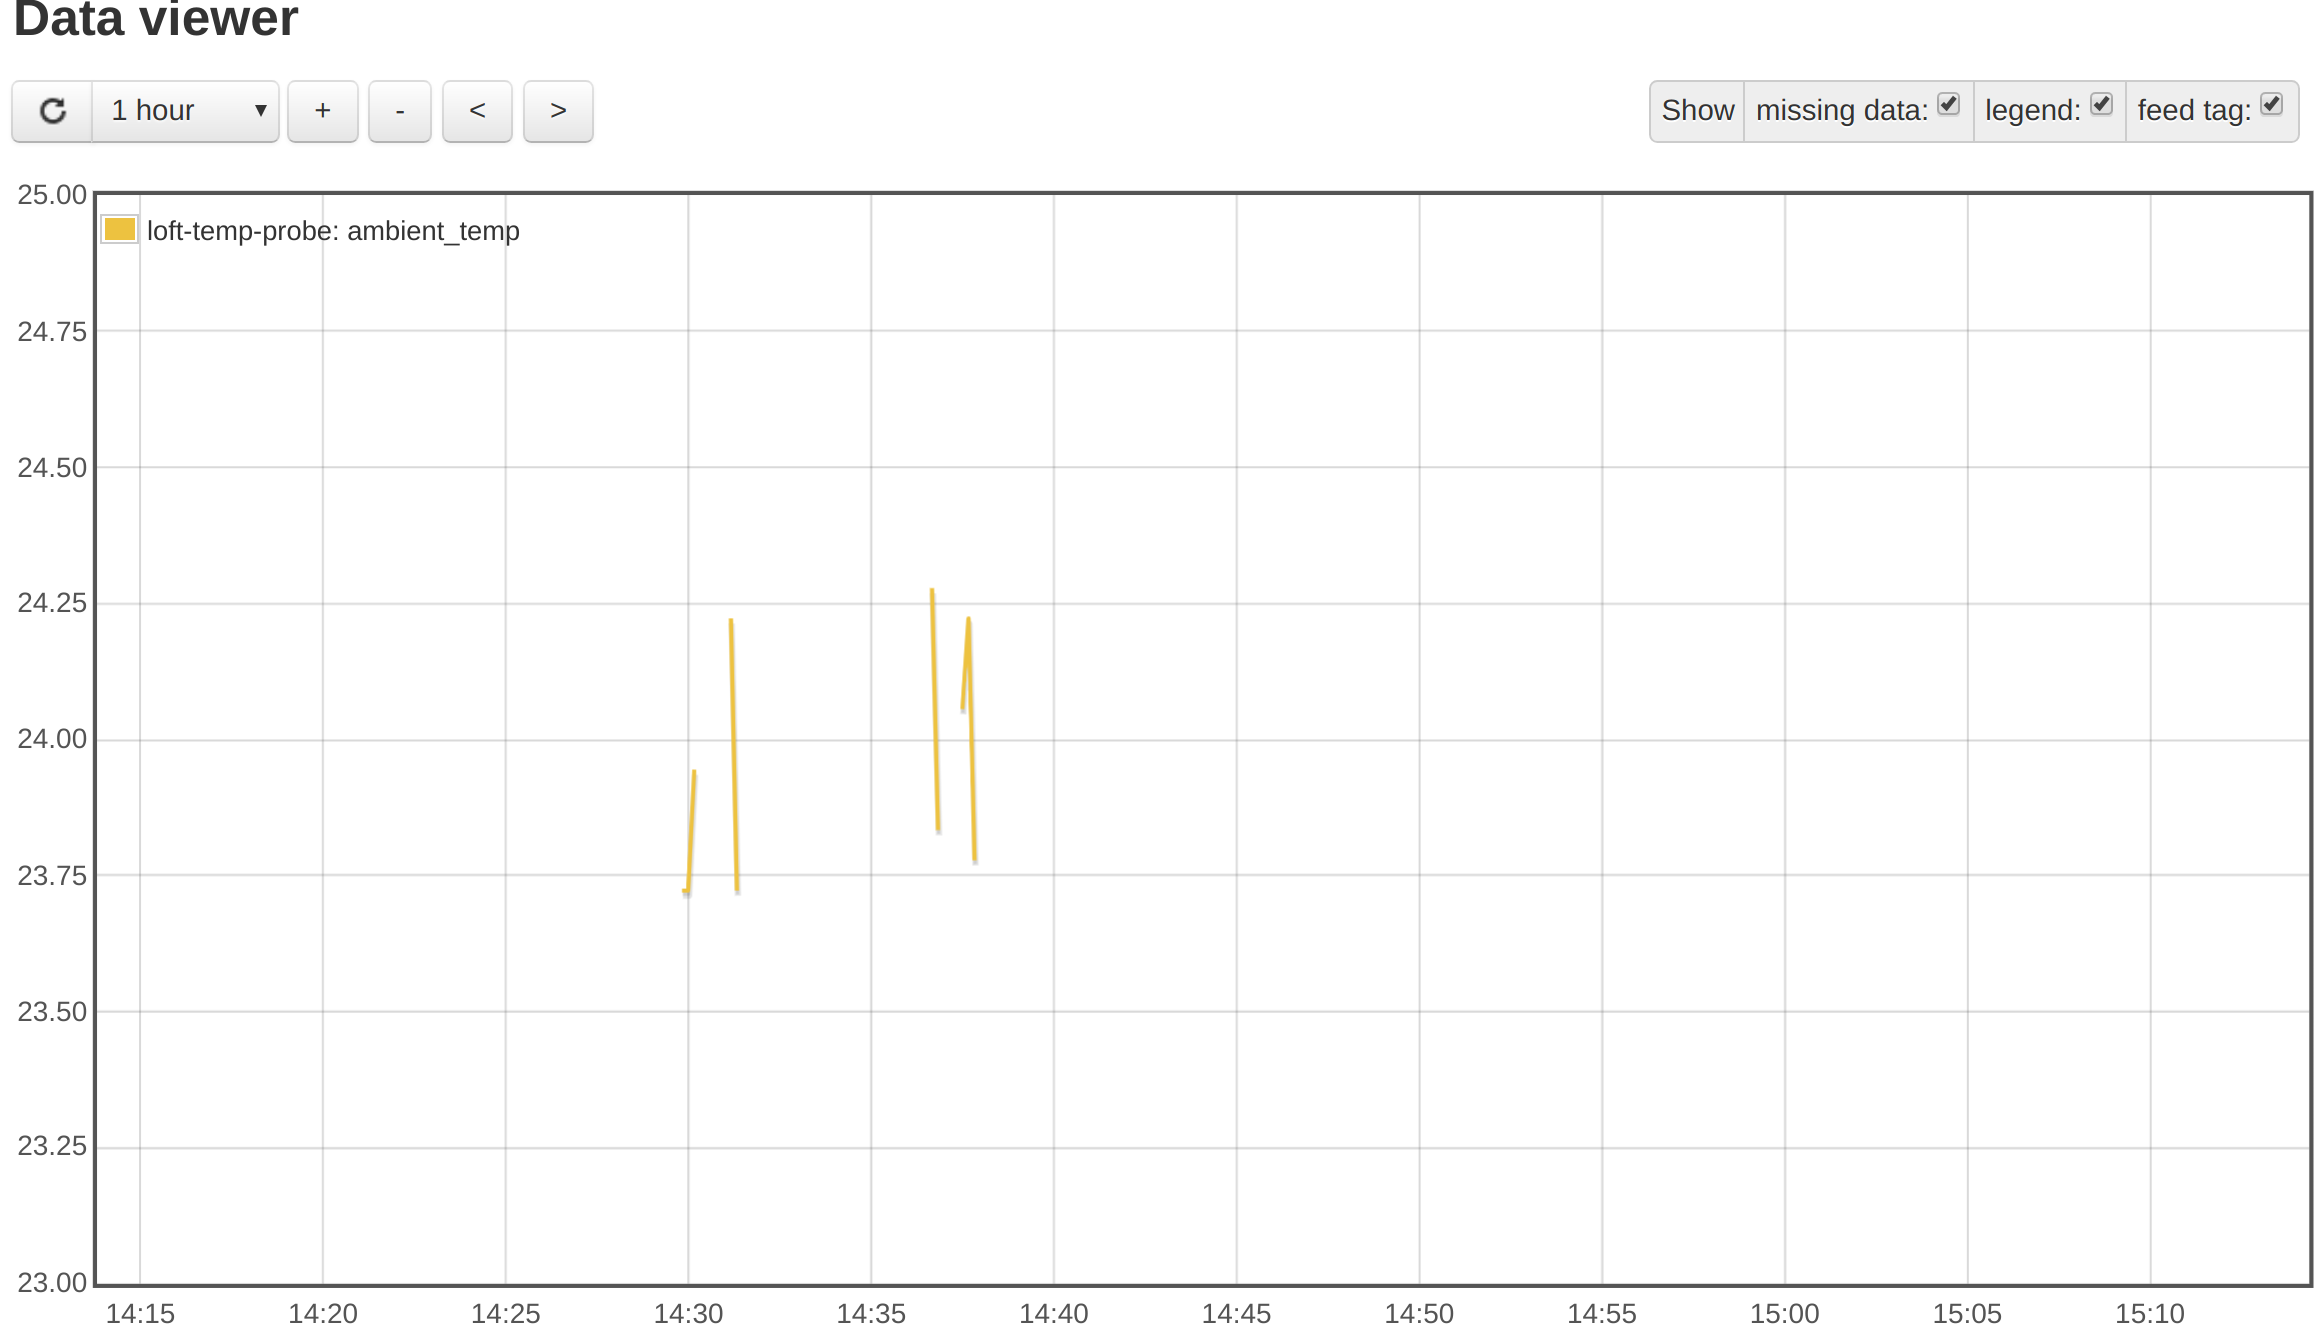
Using the Data Viewer
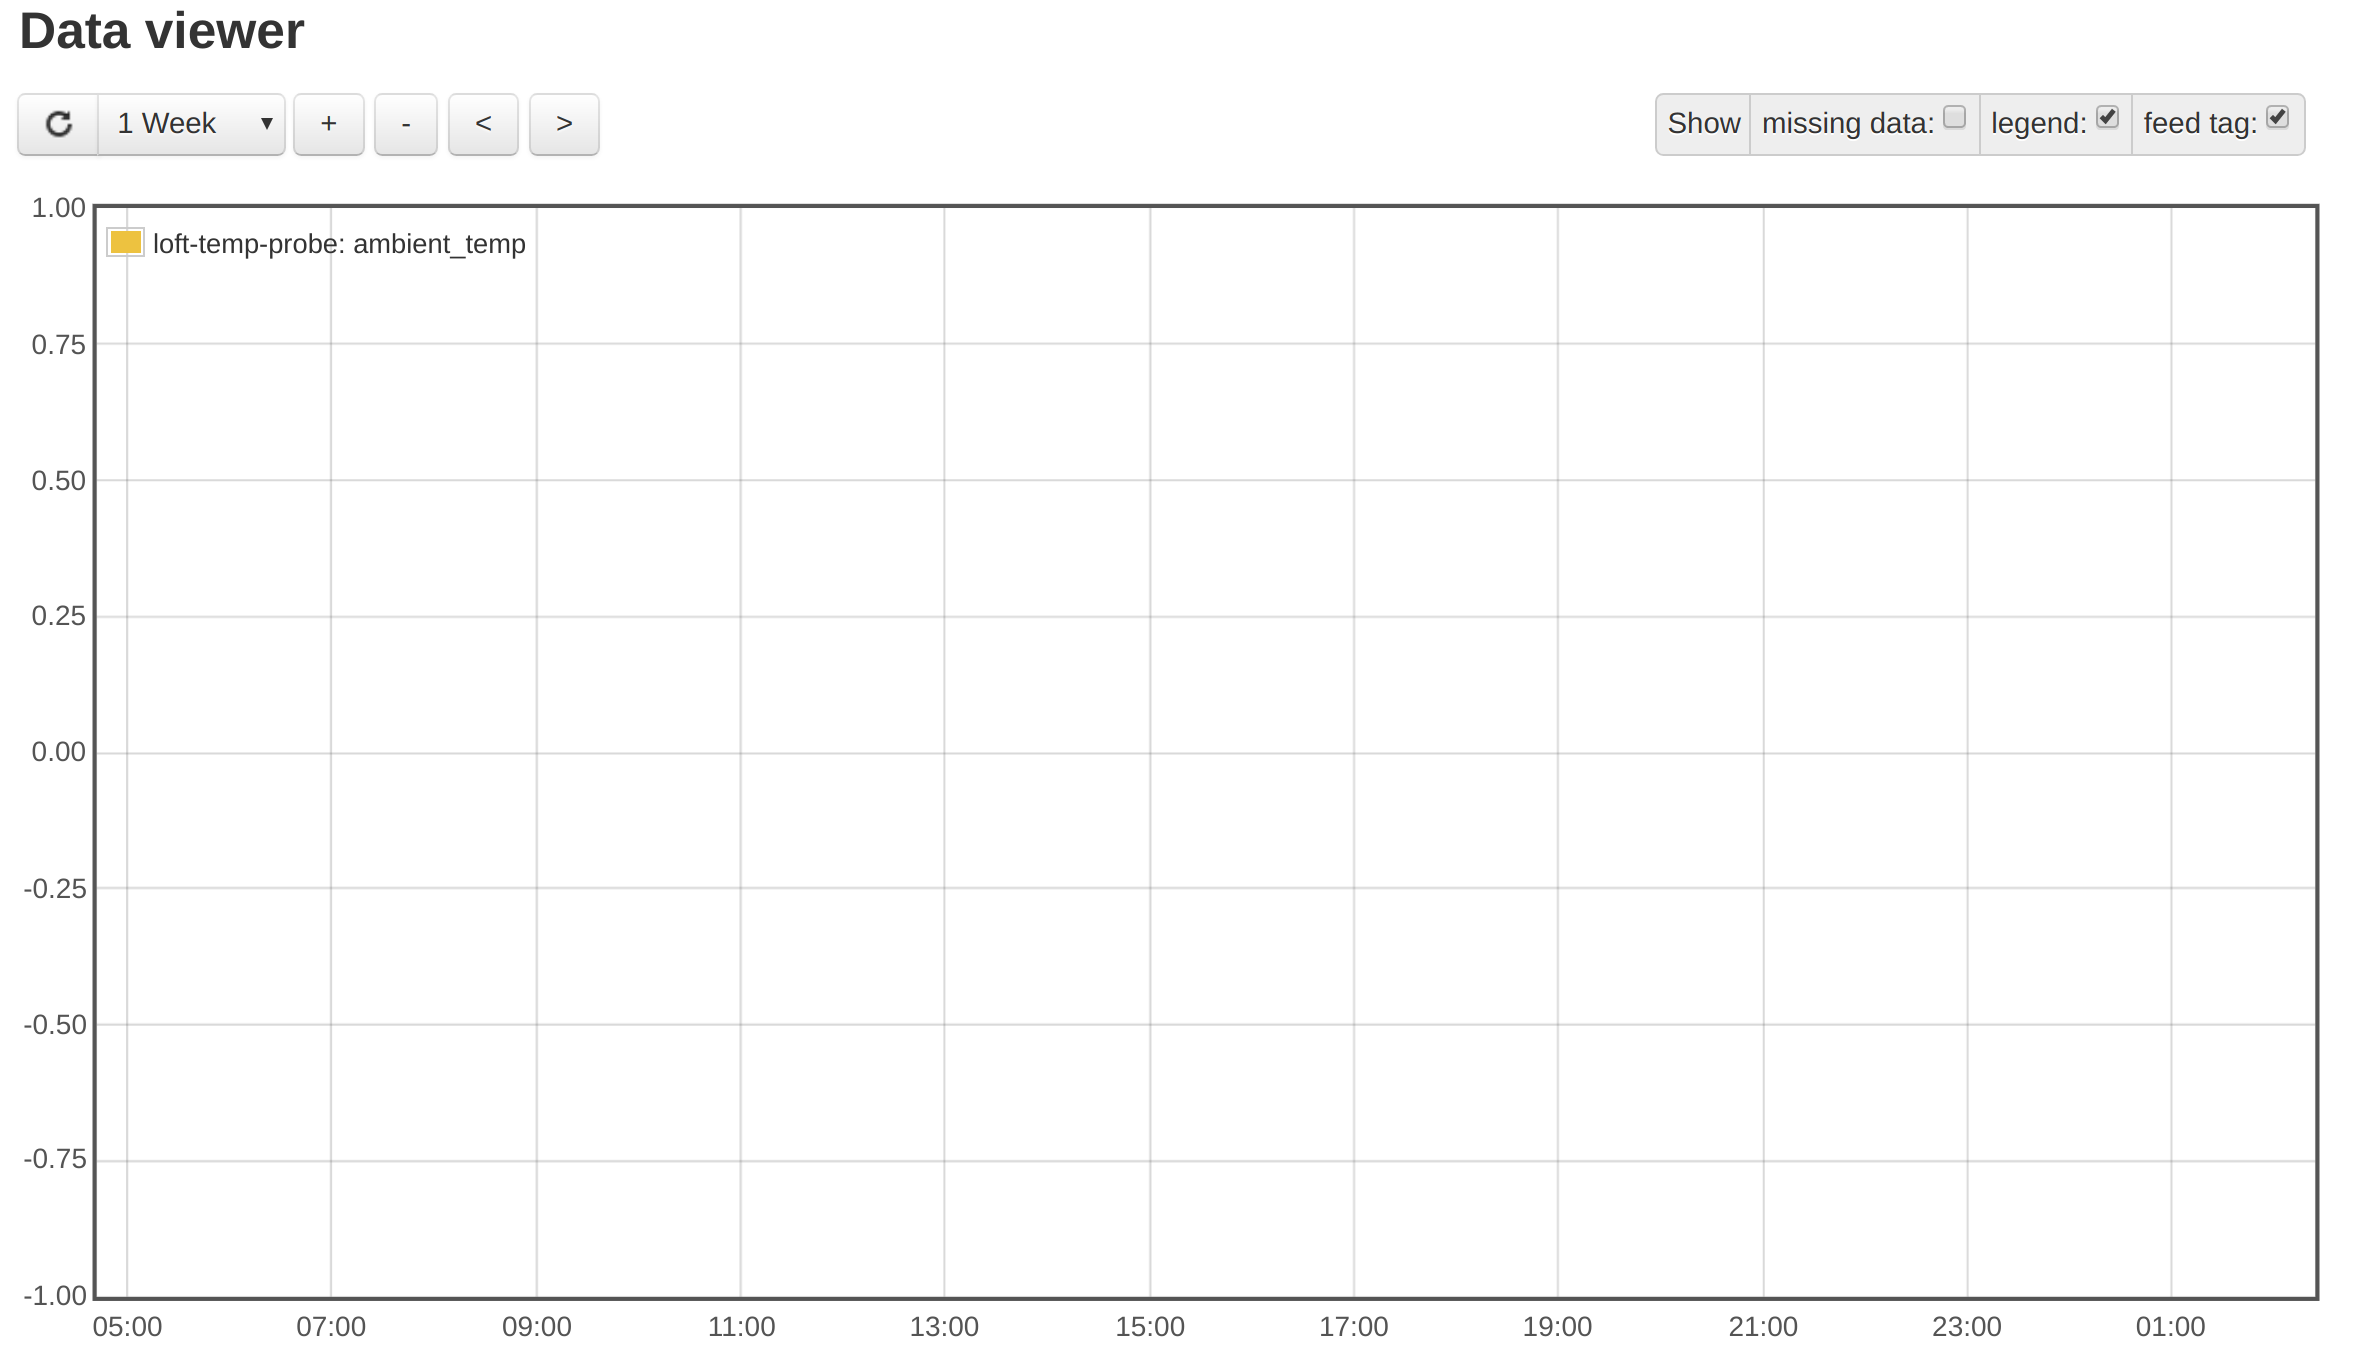
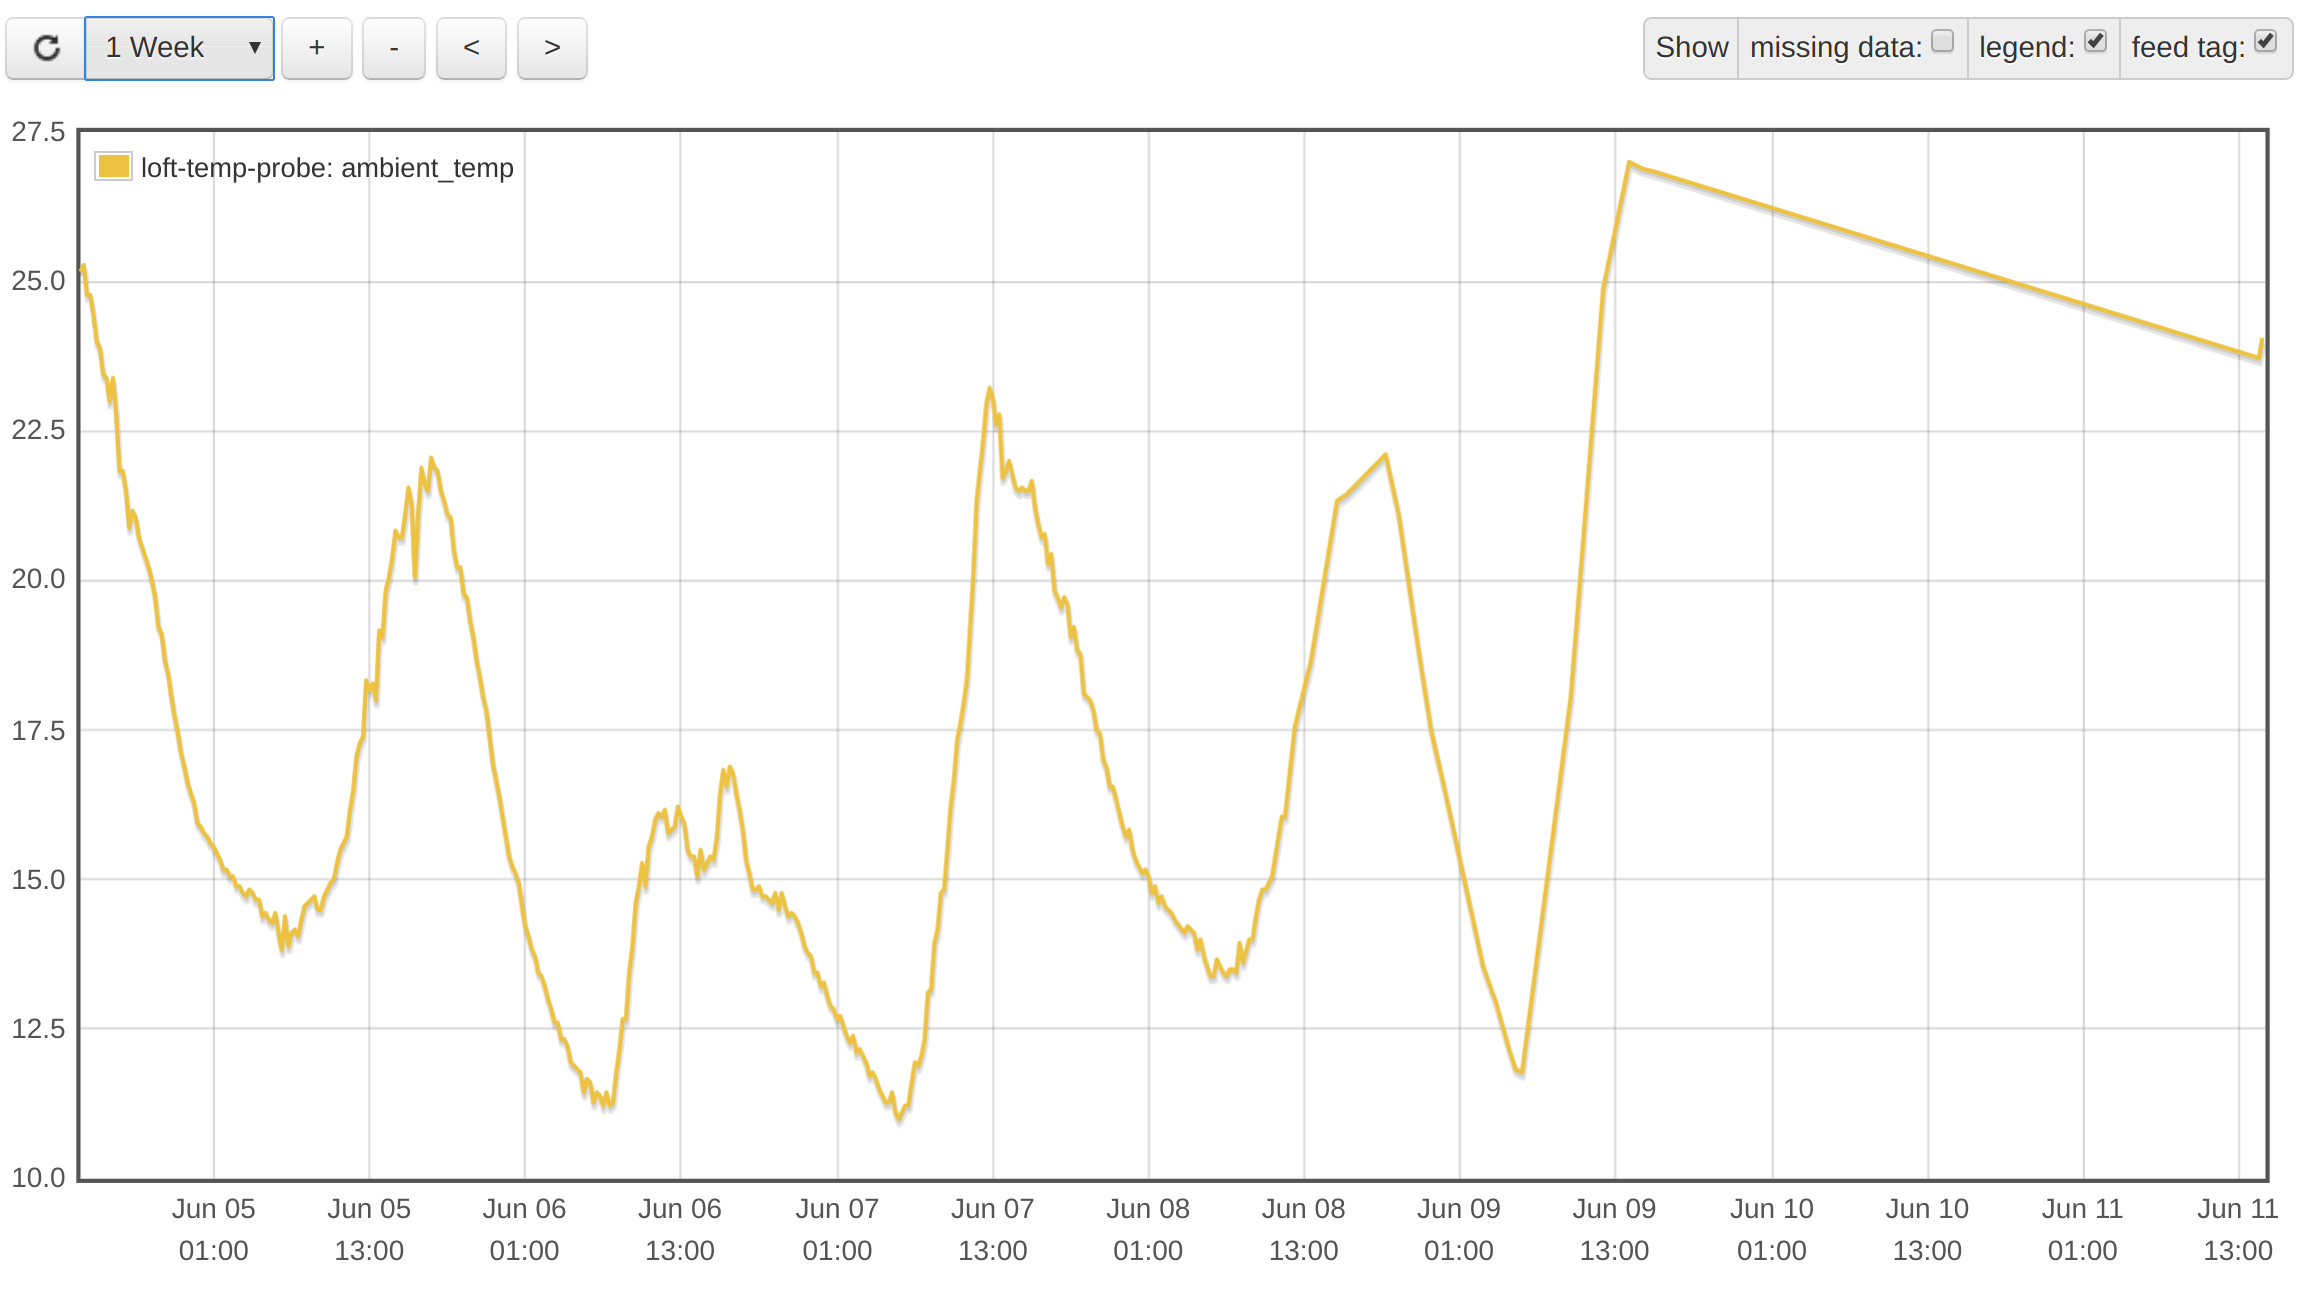
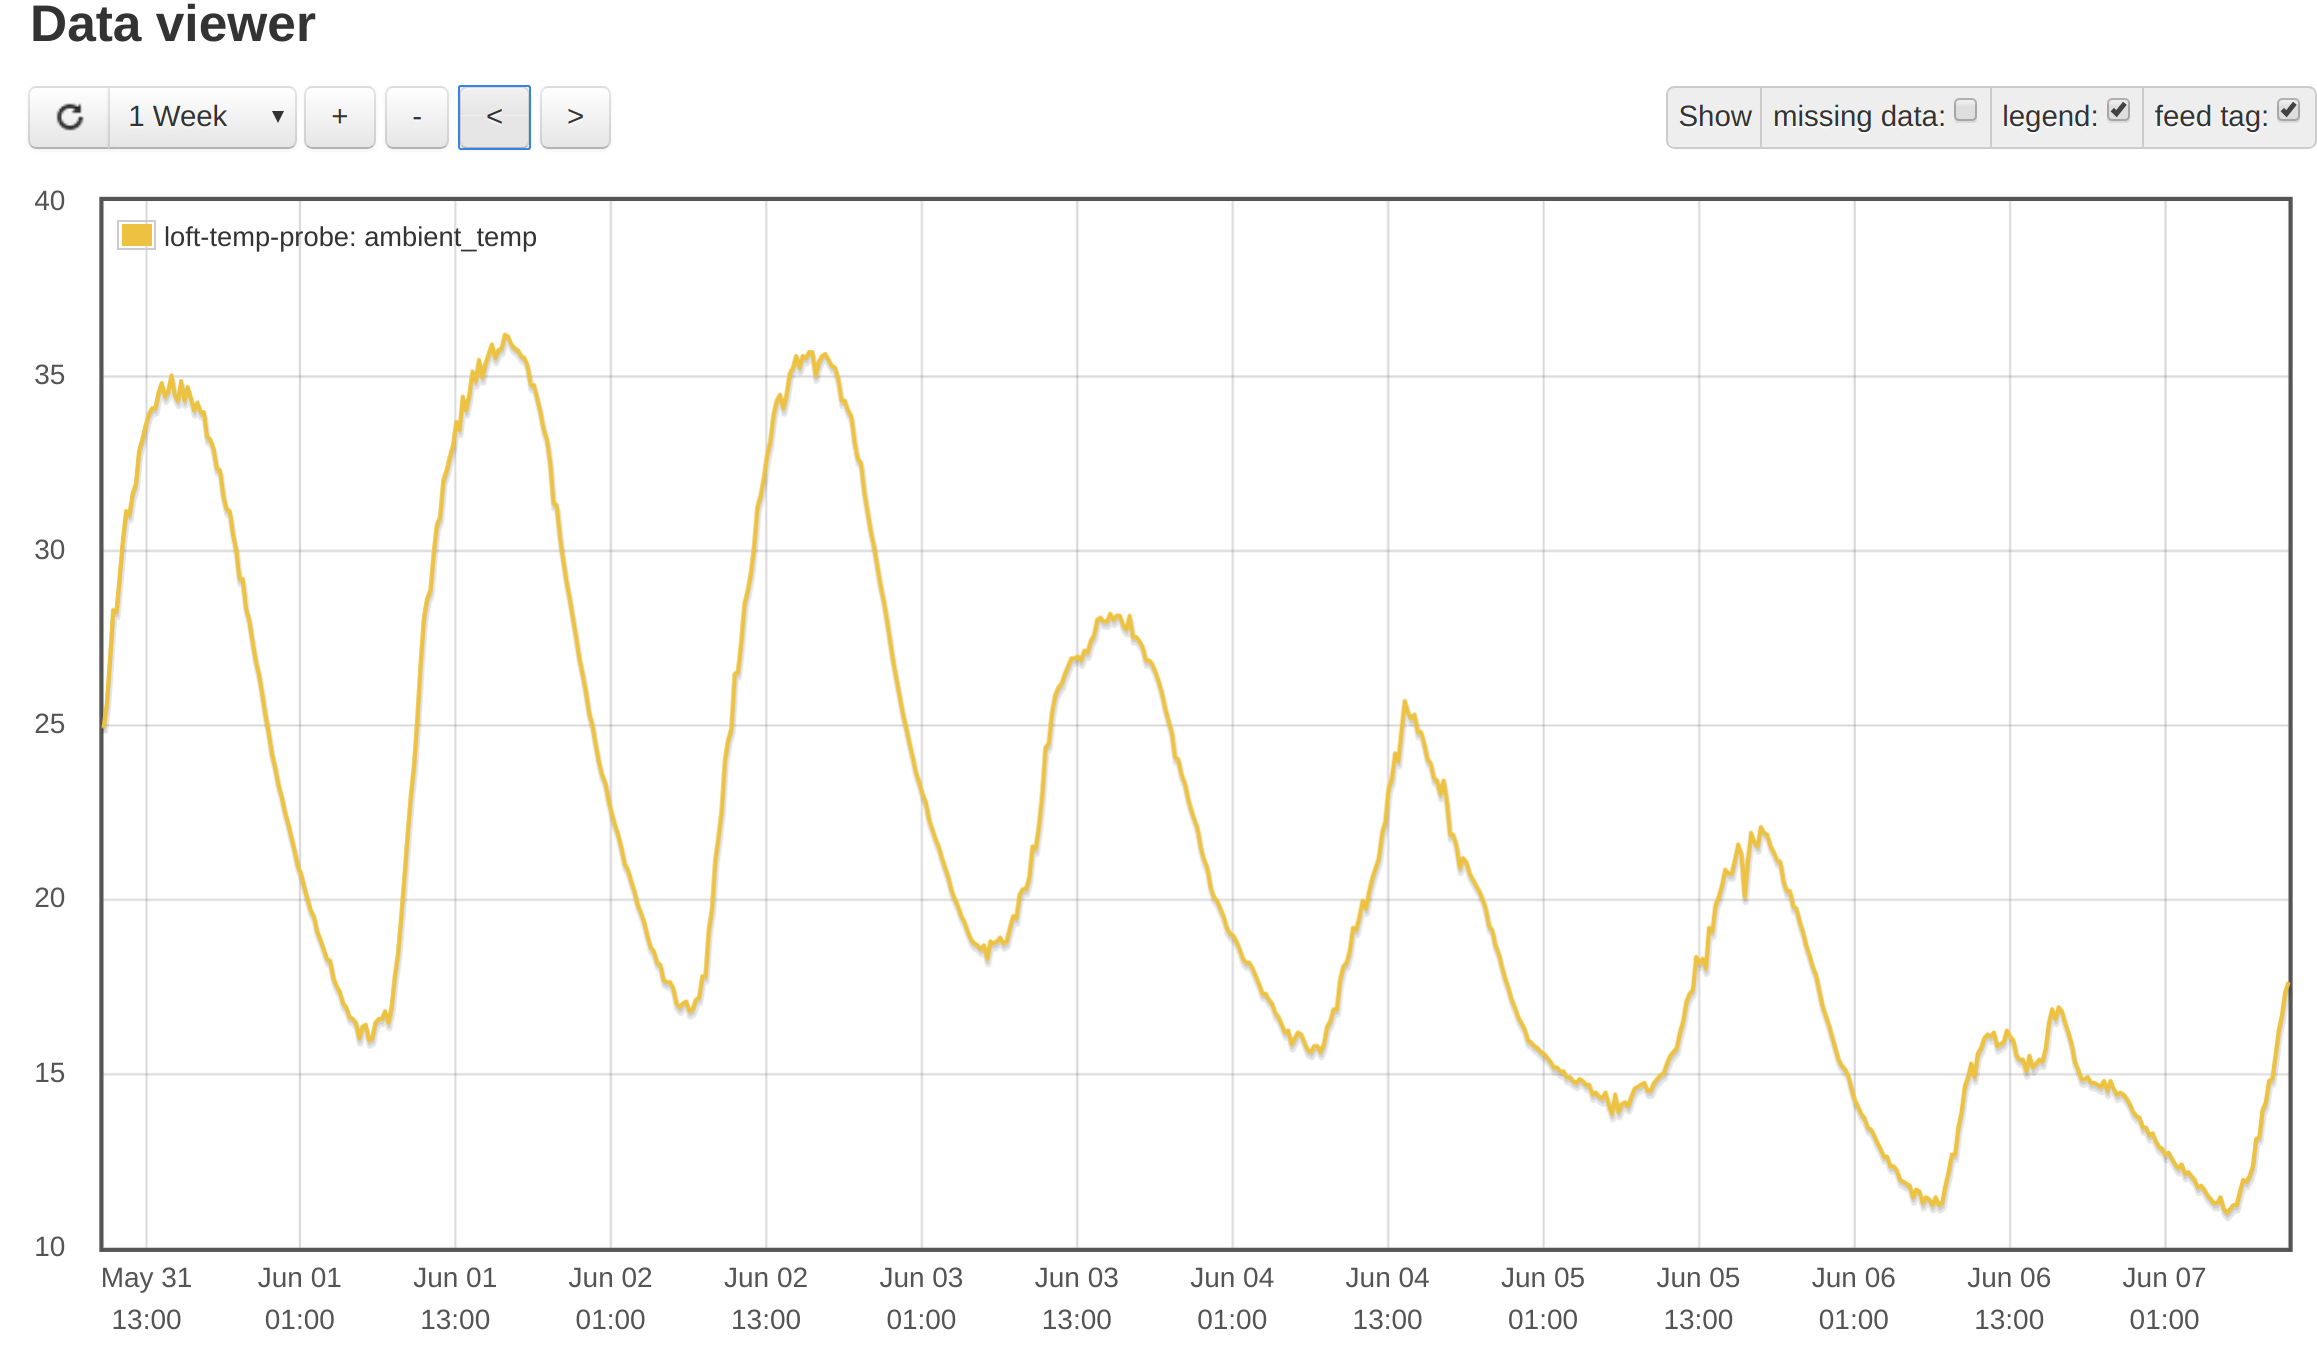
If i look at the data at the “1 week” view there are chunks that appear to have no readings
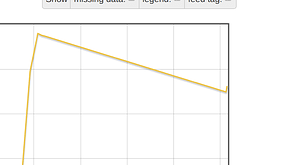
If i zoom into that time at the “1 week” view its still missing, change to the “1 hour” view and magically the data appears.
In fact at any level except “1 Hour” the data disappears…
Help!!
The graphs average the data points (there is a maximum of data points it can retrieve) and that can cause odd things. The other thing is to set the data interval at the feed interval. It will limit the maximum zoom to can do.
OK
this is getting more weird.
what exactly does the “missing data” button do?
If its “missing” how can it appear to have data for specific date times?
I am so confused as to what has data and what does not have data right now.
Without it, the graph just joins the dots that exist even if there are gaps. With it selected there must be data points next to each other in the timeseries. This option shows you emoncms did not record data where there are no lines. If you zoom in you will probably find odd data points which is what the other graph is.
What does the Inputs and Feeds page tell you? Check the admin page, are the logs full? don’t just reboot. it is fixable (probably).
OK. I think I’m starting to understand this.
My data is being sent once a min. the log data type is set at a 10 sec interval.
so the raw data looks like
so the data I send is all there, its just got lots of blanks in it.
so…
how can I convert the 10 sec data log to 60 sec? without loosing any data I’ve already got?
what I don’t get is that I’ve not changed the log type and its only showing up with the past few days of data…
Nope, the same bash script on a remote server.
I had edited some of the data records when it was sending duff data, but thats it.
Look forward to Trystans answer
The timeseries graph records as metadata the Unix start time and the interval. Data “slots” (records) are created at every interval. Data that arrives within the time slot goes into the appropriate record. Otherwise, the record is NULL.
On retrieving the data, times are calculated from the metadata and the record number. If the graph (at the scale you choose) happens to pick a NULL value and you haven’t got “missing data” ticked, it joins the dots it knows about either side. If you have got “missing data” ticked, you see a hole.
Having seen the raw data that makes total sense
Now how to remove the null’s and convert it from a 10sec interval to a 60 sec interval data set - so that the empty records disappear!
IME, if you were getting data at 10s intervals and it is now 60s something must have changed! It hasn’t magically decided, of it’s own volition, to change the rate. GIGO.
You need to edit the metadata to change it to 60 s intervals, read the existing phpfina file and pick out the non-null values, drop them into the correct records in the new file, then rename both files. And all while it continues to record the data.
It’s not trivial.
The reason for PHPFINA was to save the file space occupied by Unix time for each record in PHPTIMESERIES. With 5 NULLS between readings, it will only save you 1 byte per minute (11% I think), but give you decent graphs. If you convert the PHPFINA to 1 minute, you save 80% and still get decent graphs.
it never was getting data at 10 sec intervals. This is the error on my part i should have chosen 60 sec intervals on the PHPFINA data given my cron job runs every minute.
Just read the “Learn PHPFina.php”.
although it seems out of date as it talks about $id.npoints file - which doesn’t exist anymore - i guess it was changed to just using the filesize now.
OK looks like I’ll be re-writing that feed.
open the meta data, get the start time and its interval.
create a new phpfina feed at 60 secs intervals - create it with the same start time
then read from the source - if there’s a record at the 60 sec marker then use it
otherwise use the nearest one
FUN!