I have installed emoncms v9.5 on a new ubuntu 14 cloud server. Everything seems to be fine- inputs are coming in, I can make feeds, but when I try to add widgets to a dashboard all I get are the five hooks on the box. Nothing I do makes the widgets show up properly.
Once you selected the hooked box, did you use the configure button to choose feed to show and eventually other settings ?
Yes. When I work with an emonpi with a standard image, the widgets appear.
I have done three custom installations: local intra-net server with Debian 8.1; a cloud server with Ubuntu 14 and Raspian on an emonpi.
In each case, as far as I know, I followed the respective instruction sheet on github carefully and mostly understand what I was doing. The result in each case is the same: everything seems fine, except that the widgets don’t appear.
This is a bug in the dashboard creation code.
You have previously started creating a widget and not configured it, and therefore all subsequent widgets do not show for some reason, even if they are configured.
The rub is you have now no way of “seeing” the first unconfigured widget, it’s invisable !! so if you remember where you left it great, if not you need to start randomly clicking around the page until it shows up. Once found you can delete it or configure it and the subsequent widget(s) will then magically appear.
If you have nothing else on the dashboard then just start again, it’s easier to delete the dashboard and create a new blank.
Moving forward - never leave a widget unconfigured !
Maybe this should be fixed, Since no one else has reported it I assumed it was something I had done when I spotted it a few weeks ago.
Thanks. It also seems to help to work with Chrome as your browser- which has lost 32 bit support, but I found a copy. Firefox often has problems because it deprecates http in favour of https. I still need to set up an ssl certificate on my servers.
So I have been using Opera, which absolutely is not showing anything.
I noticed that if I clicked in the right place, the box came back, but did not realise that I have to delete all the previous widgets… I suppose I just got lucky with the raspian. An awkward mixture of two issues.
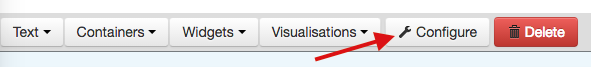
Using a clean install of 9.5 from the SD card image on a local Pi, I’m experiencing strange behaviour when trying to create a (first) dashboard. Pressing the ‘new’ button seemed to have no effect for many, many presses. Eventually, after logging in and out a few times, I was suddenly offered a dashboard. However, it doesn’t seem to be drawable. When I click to actually make up the dashboard, I only get two buttons, ‘Configure’ and ‘Delete’. No ‘Text’, ‘Widgets’, ‘Container’ buttons etc.
Is this the same issue?
We have just pushed a v 9.6 update please confirm if it fixes this issue
just did an update to 9.6 on my hosting account, not pi, and again the same problem with zoom graphs that are sql driven
the one with phpfina feed behind works
checked on Opera and FF, both death
changed zoom.php with 9.4 version and feed is back live
little update on latest revision I installed today on my self hosted version of emoncms.
Upgraded to 9.7.1 and this time all the graphs work correct.
Just to let you know that for me this is now solved
1 Like