Hi,
I’m hoping someone will be able to help as I’m drawing a bit of a blank.
I currently have a emonTx4 monitoring our heat pump and would like to combine this data with what I’m downloading from Octopus through their API.
I appreciate this isn’t ever going to be real time but I can’t currently justify having further monitoring kit on the main fuse board.
I’ve currently got a 30m accumulator on emonTx4 and the Octopus data. However, I’d like to subtract the heat pump from the total to get a “rest of the house” reading.
The trouble is that that I think this needs a delta before doing the subtraction… I think. I’d be happy to do this at source, post-process, or even just on a graph but am struggling to make much headway.
Any help much appreciated.
Thanks,
Chris
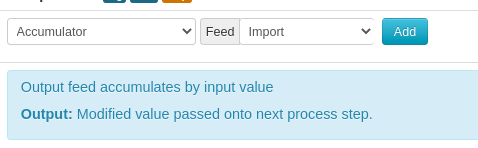
I’ve found this works best with cumulative kWh feeds, one for heat pump and one from Octopus. Trick here is to use the Accumulator process step, as the numbers from Octopus are kWh per half-hour.
(or you can use my python script to fetch historic data via their API - see background post)
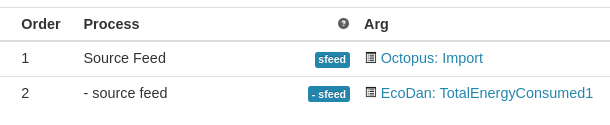
Then create a virtual feed that simply subtracts one from the other:
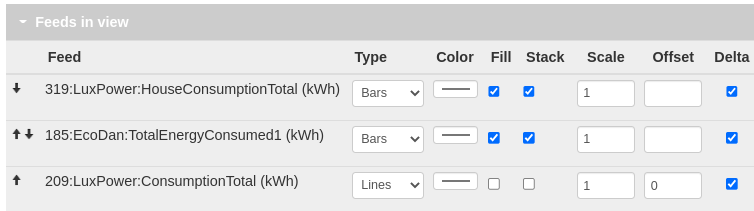
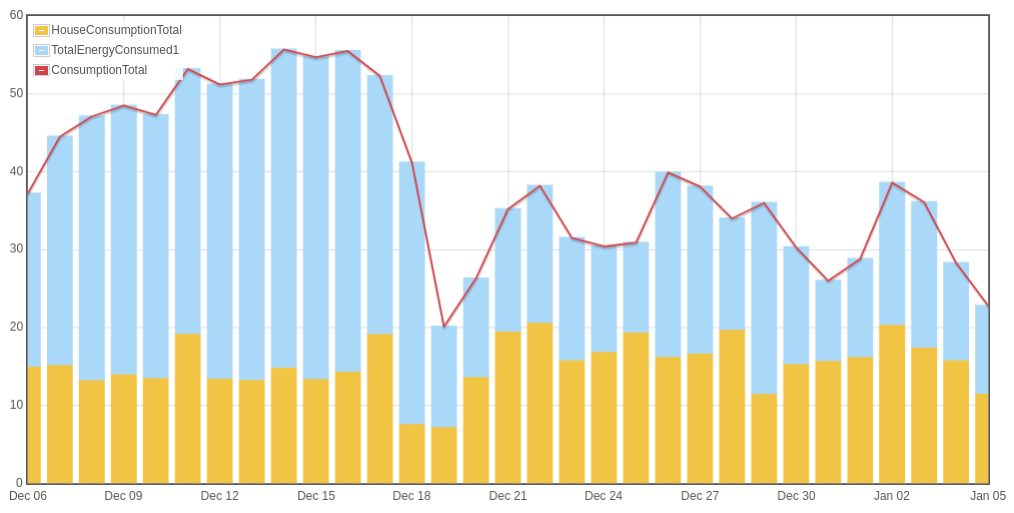
You can then plot the House + Heat Pump kWh feeds as Bars with Fill, Stack and Delta with hourly, daily, weekly or monthly interval. Stacking the feeds should match the total consumption (by definition).
1 Like
Thanks @Timbones! Much appreciated.
One question…
Do the two accumulator feeds need to have a common start point? I’ve been trying to reason whether it matters or not with us having the deltas but I can’t convince myself either way.
I currently can’t get it looking as good as yours and am wondering whether that has something to do with it.
Thanks,
Chris
No they don’t if you’re only plotting the deltas. Obviously you’ll get bogus data for dates before both feeds have properly started, but adding a “Allow positive” step to the virtual feed will probably sort that.
1 Like