Hello,
I have 2 sources (total kWh with 2 different costs and updated every 15s) with the same process list :
1 Log to feed Node 1: node:1:HCHC (feed last value:1056264.00)
2 Wh Accumulator Node 1: Consommation HC (feed last value:29733.00)
3 Log to feed Node 1: Log Conso HC (feed last value:29733.00)
I have about 1 weeks of data and it show correctly with “BarGraph” and delta=1.
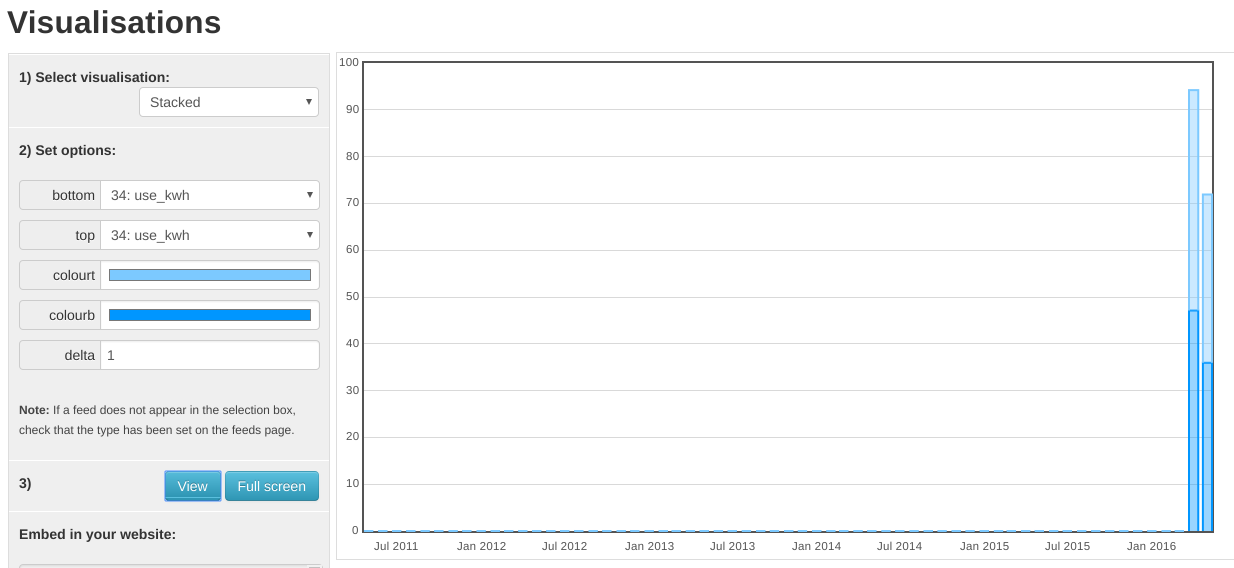
With Stakced, I setup with “Consommation HC” and "Consommation HP) but output is a blank graph (Y from -1 to 1 and X : Jan)
Same with StackedSolar and Zoom.
I still have problem with stacked because we can’t choose scaling, and in the top left, unit is wrong (kWh/d when I’m looking kWh only). Don’t have time tonight to work on it …
And another problem in your view : You don’t have 30 April ! In my view I have the same problem. Today we are 18 May and I can’t see data in stacked view for 17 May …