Context
My local installation on a spare Rpi3 is barely an hour old and my order for hardware from the OEM shop is about to go off [edit: has gone off].
As a warm-up exercise, I’d like to look at some of my existing data.
I have half-hourly “usage” data (kWh) going back two years, scraped from my account with Ovo Energy and saved locally. I know the next step should be to write a little more python to read the data from my files and (?) input/bulk it into my Emoncms, which I haven’t yet configured (so it has no inputs and no feeds).
When the hardware arrives, I’ve no doubt that a suitable set of inputs & feeds will suggest itself, but that could only show me newly logged data, i.e. information going forwards. At the very least I’d like to be able to see my historic data and, ideally, I’d like to see them joined seamlessly together.
I’ve looked for any worked examples along these lines, but the nearest I can find is this agile.py
which I might be able to adapt. Might there be a better place to start?
Hello @SimonD what format is your Ovo half-hourly data? I might be able to suggest a script to import.
I am working on an interface that will be built into emoncms making it easier to drop in CSV data to create feeds from existing data but that’s a little way off (hopefully one to make things easier in future).
Hi Trystan, and thanks for the rapid response!
json - in one file per day, to match the pages offered by Ovo’s unsupported API. For example, one of them starts off like
{"electricity":{"data":[{"consumption":0.177,"interval":{"start":"2021-03-12T00:00:00.000","end":"2021-03-12T00:29:59.999"},"unit":"kwh"},
but as I wrote the file originally, converting it to another format (or faking any needed missing information) should be easy enough.
Cheers
PS originally it was a pickle dumped python dict, but I wisely opted for something a little more portable.
Thanks @SimonD ok great. Looks like a similar format to the Agile data. If your comfortable with python modifying the agile.py script is probably your best bet actually, it covers creation of a feed to insert the data into and then sending data using the feed/insert api
Ok @TrystanLea, thanks.
I imagine that playing around with this will give me sorely needed practical experience in configuring emoncms, and the result should be the capability to (re)view purely historical data.
Assuming that goes ok, I hope to be back with more questions, on how to do this in a way that achieves that “seamless join” of historic pre-emonpi data with new (and live) emonpi data.
Perhaps I should report back with my success or otherwise in any case 
Thanks again!
‘s truth.
I’m somewhat taken aback to have got this far, this quickly (screenshot):
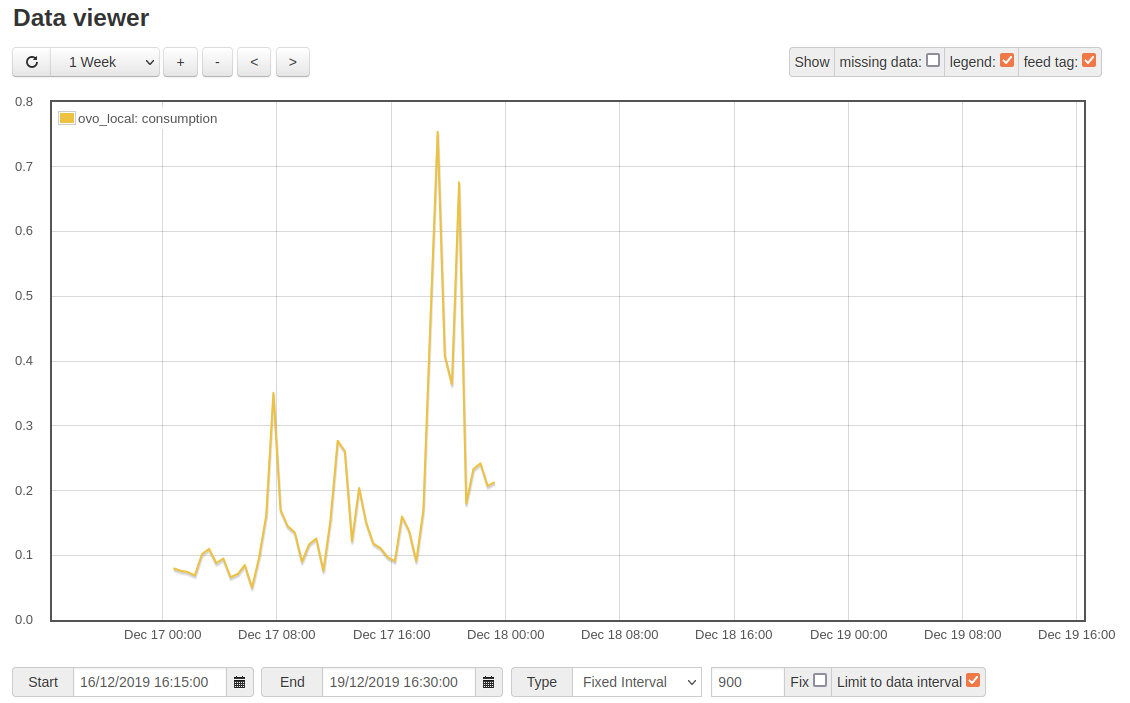
That’s to say, I hacked the agile.py script to make it read some of my old data files from ovo, and do an input/bulk of the first day’s worth. Which I can now see on a graph in my local (and still very new) Emoncms. Loading the other 600 days’ worth should be easy.
Grateful thanks to @TrystanLea for encouraging me to go ahead and try this approach.
The emonTx, RFM69Pi, etc hardware won’t arrive for a few days yet, of course, and I can spend some time until then just finding my way around this software. But I’m left with a question (remember I’m a complete newbie in this):
Do I have to do anything special, in the way of setting up input(s) and feed(s) to get this old data on the same graph as my new, live data?
Edit: adding those data turned out to be easy, but I learned they do have to be in chronological order - see Emoncms and historical data - #4 by TrystanLea (which I had done anyway). More awkwardly, ovo’s data have occasional gaps, which might be the reason why my attempts at post-processing to accumulate consumption data are not reliably successful: the resulting feed goes inactive, sometimes. Since I’m already having to clean up occasional MAXINT values for consumption (arising from ovo’s continuing inability to deal sensibly with occasional missing smart meter data), I suppose I might as well make up a few more values to fill in any gaps…
I also imported a lot of historic data when I migrated to Emoncms. I decided to create new Feeds for the live data since it’s being recorded at a finer time interval than my historic data. I use MultiGraphs for visualization, so it’s easy to put historic and live Feeds on the same chart.
Hi @sroof and thanks for the explanation. I’m acquiring live data rather sooner than I expected and I’ve ended up with essentially the setup you describe (if more by accident than design!)
I’ve decided I’ll carry on importing smart meter data for a while (perhaps indefinitely for gas, since I’ve no other source of information about gas consumption) because, for now, I’m finding it useful to cross check kWh from the electricity meter (via the utility company) against counts from the optical pulse sensor. [I’m hoping the newly fitted smoothing capacitor (thanks to Robert Wall for the encouragement to do that) will improve those results.]