I have an input which represents the state of my central heating thermostat. It has a number of different values relating to the ambient temperature, but the main ones of interest for this question are 0=“heating off” and 1=“heating on”.
What I would like to do is have a text box on my dashboard that shows what % during the current day that this value has been 1.
E.g. if the heating has been on for 60 minutes, it would show 4.2% (1hr out of 24hrs).
Along similar lines (and possibly more meaningful), a text box that would say 60min in this example would be good also.
Note this may not be a single 60 minute period of heating - more likely several shorter periods throughout the day. It is just the daily total i’m looking for.
This data can then be logged, and compared week-to-week, or even year-year etc.
So, I know I have the Input/Feed with the values.
(If necessary I can manipulate my script that sends the data into EmonCMS to have a separate input that is only 1 or 0, and sends 0’s instead of the other values (4,5,6,7 in my setup) if that simplifies the solution things further.)
What should I be looking at to create/edit functionality to generate the stats i’m looking for?
I’m comfortable to tinker with code if needed, so i’m not necessarily asking for a ready-to-go answer, unless it is really simple and i’m missing something obvious of course!
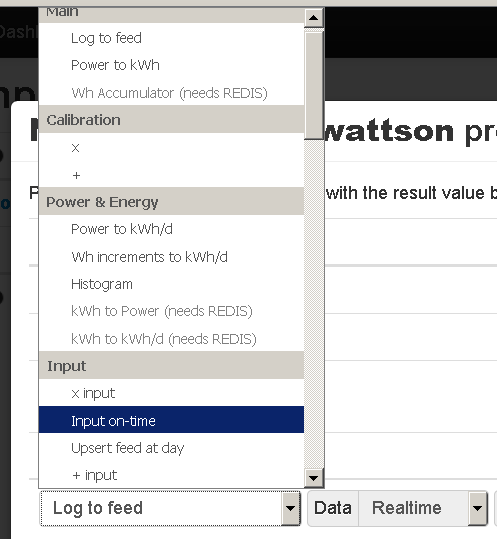
I’ve not used it, but there is a choice on the process list setup page pull-down menu named input on-time that should enable you to make that calculation.
When slected, the caption box reads: Counts the amount of time that an input is high in each day and logs the result to a feed. Created for counting the number of hours a solar hot water pump is on each day
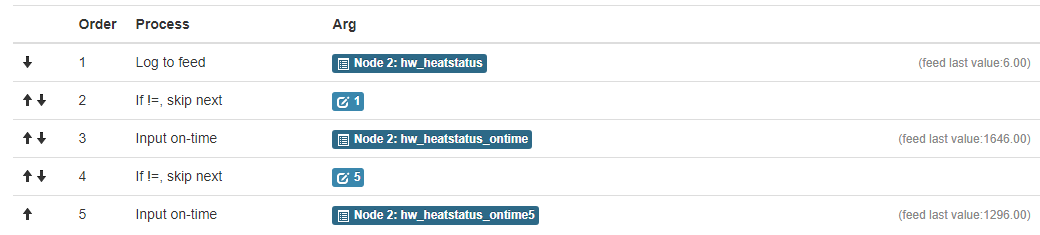
So it turns out my hot water controller has 2 different states for different types of heating it is doing (heating during the defined schedule is status value “1”, pre-heating to get things to the desired temperature by the start of the defined scheduled is status value “5”).
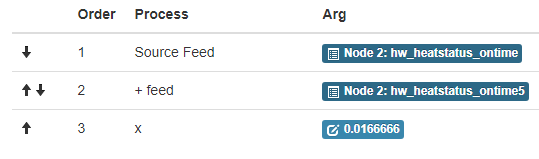
So, I edited my input to create the following feeds
Update: The above is working, however now and then I seem to get a number carrying over instead of resetting to 0 at midnight.
I think this relates to when there are days when the status never meets the criteria (ie state=1 or state=5 in my case). When this happens i get a random 0.83 figure the following day (which is 50 seconds represented in minutes).
I am looking into sending a 0 to a separate input at midnight via a cron job, then having that input ‘log to feed’ to overwrite whatever figure remains - i.e. to semi-manually reset it to 0.