Be wary of CT saturation

Intrigued by some recent comments in this thread: SCT-006 on emonPi

I thought it might be worth taking a closer look at the SCT-006 driving a 24R burden. @Gwil kindly sent me one to test and it arrived earlier this week.

Equipment used: Time Electronics 5077 Power Calibrator
Agilent/Keysight DSO-X 3024A Scope
Ch1 (Yellow) is the voltage across the CT connected to a 1% 24R
Ch2 (Green) is the voltage output of the calibrator (set to 40V throughout)

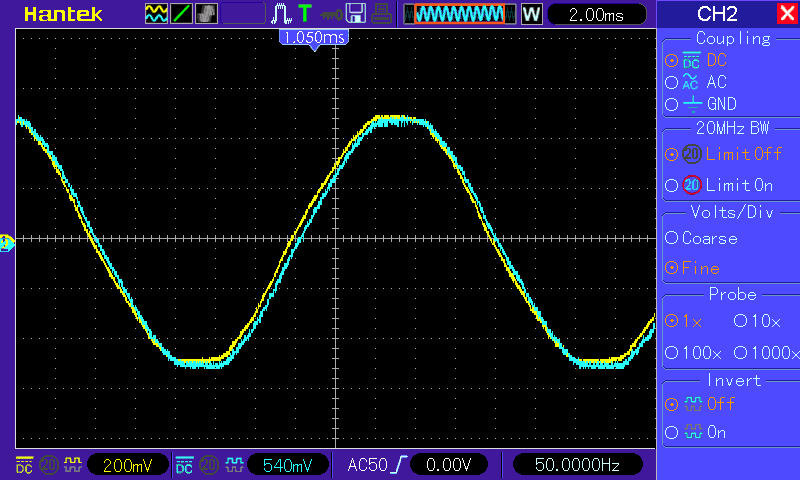
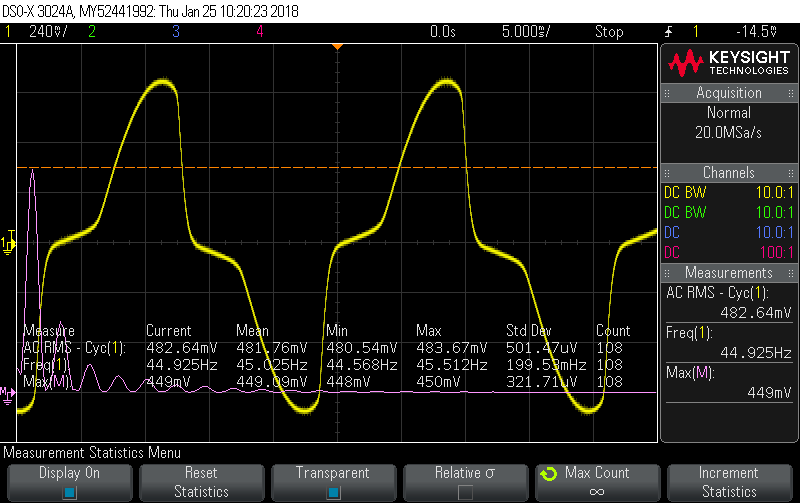
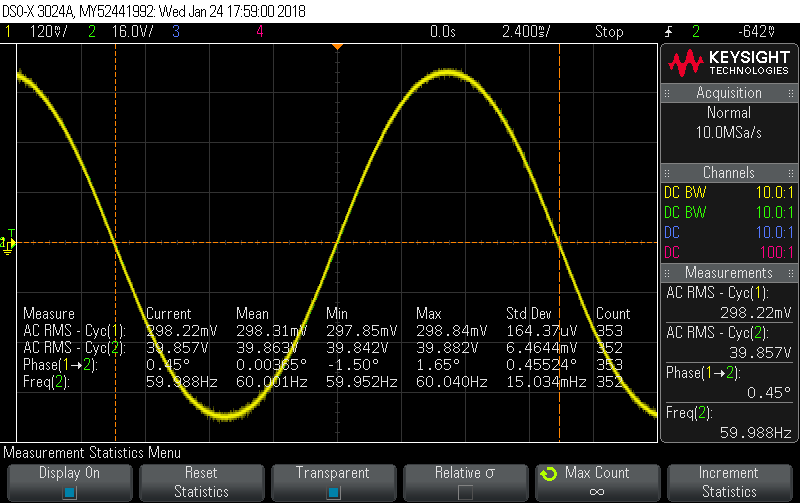
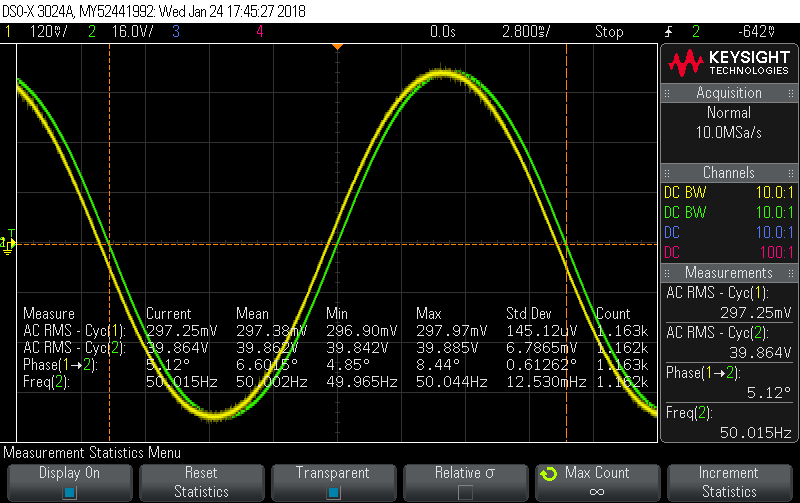
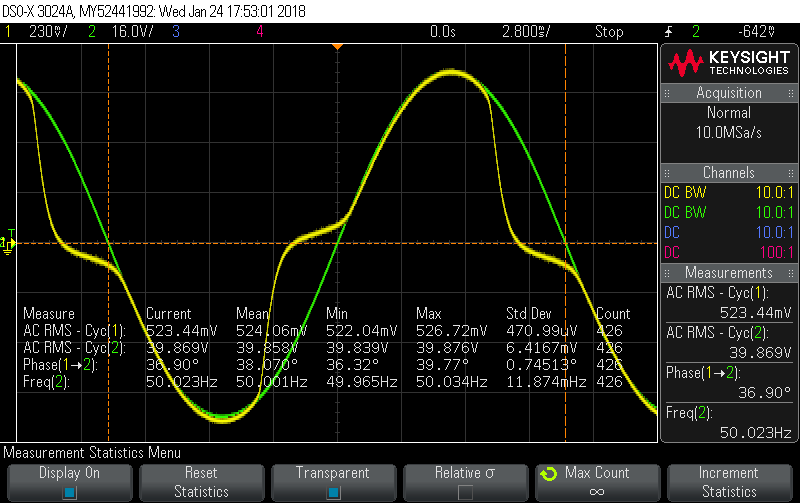
Calibrator set to 10A, 60Hz, 40V, 0° phase shift gives this picture:

When you’ve got two perfect sine waves, measuring the phase shift is pretty simple and the scope clocked this one at 5.06°, so I “calibrated” that away with…

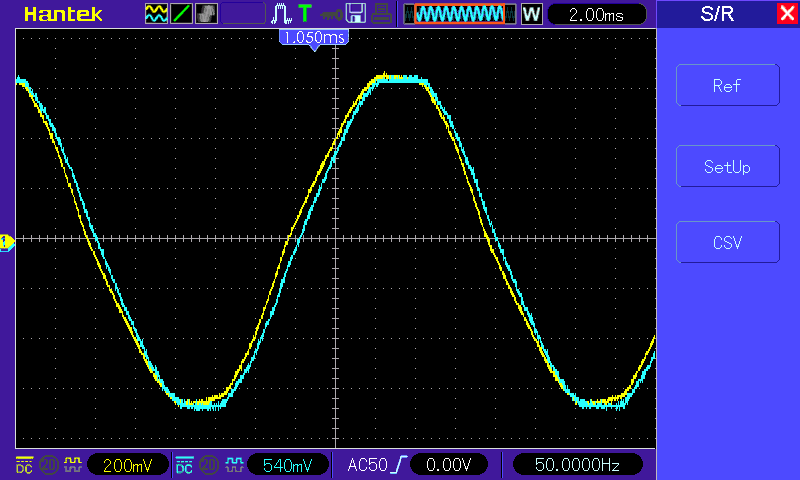
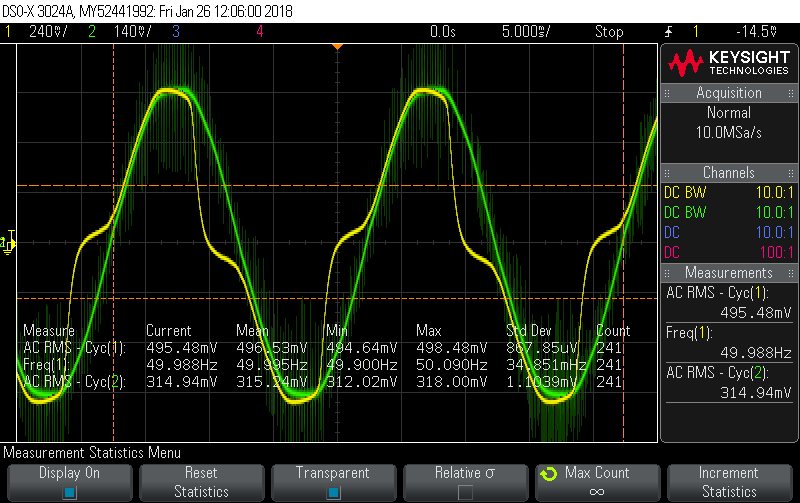
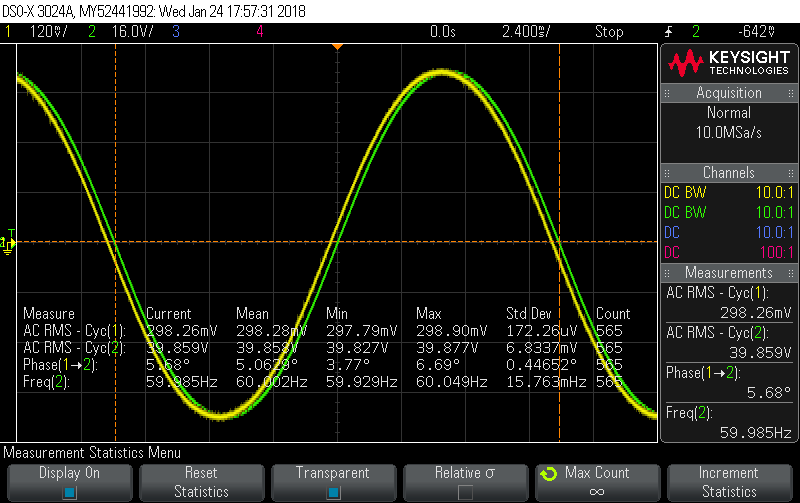
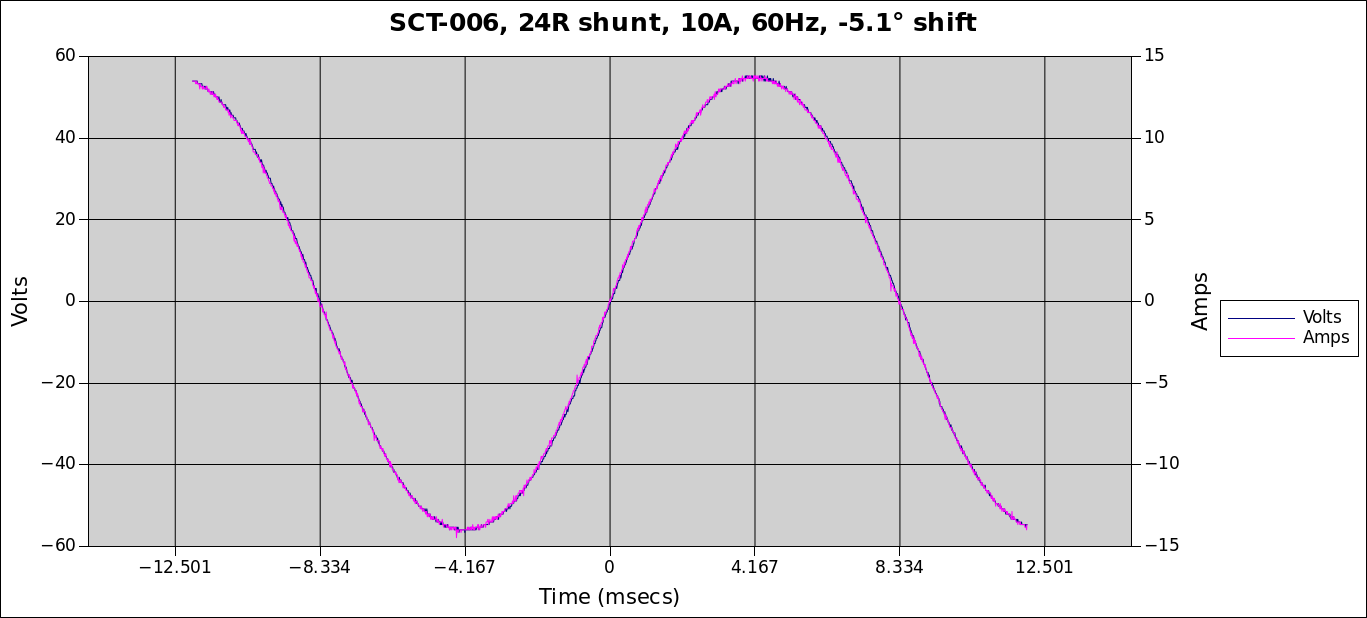
Calibrator set to 10A, 60Hz, 40V, -5.1° phase shift, which gives this picture:


scope_298.csv (87.4 KB)
(so nicely lined up it’s hard to believe there are two signals being displayed)

The four numbers in the Mean column are looking very good. Nominally they should be reading: 300mV, 40V, 0° and 60Hz. Without making any further changes to the phase adjustment (i.e. locked it at the -5.1° that worked for 10A) I doubled the current:

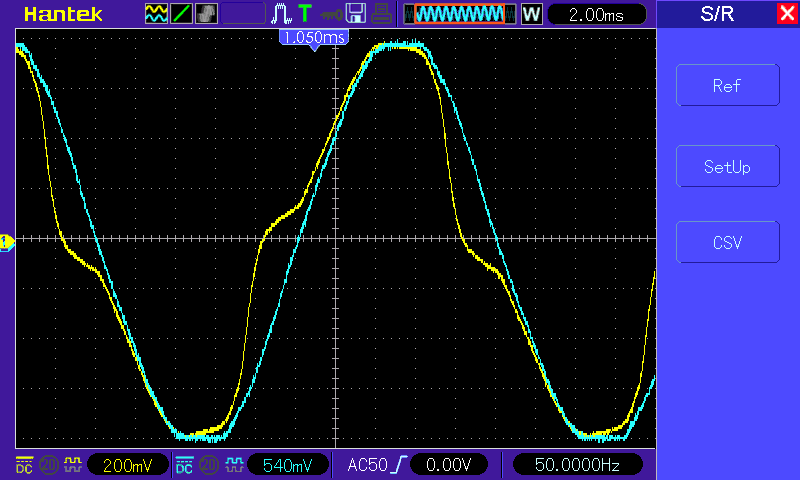
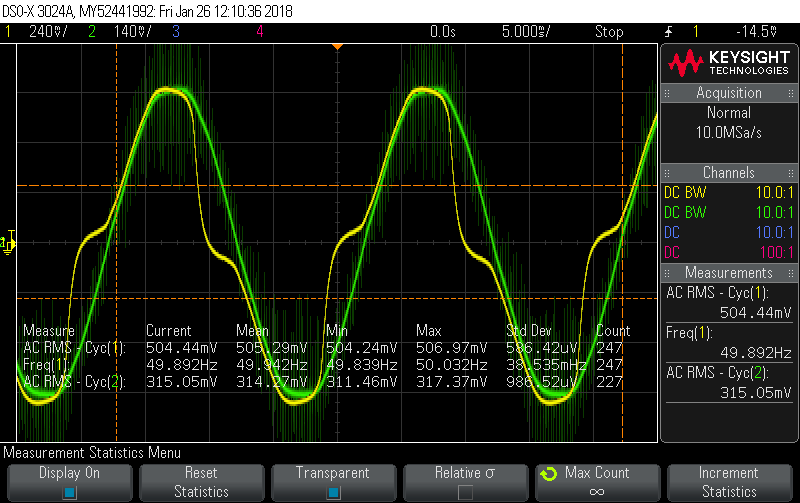
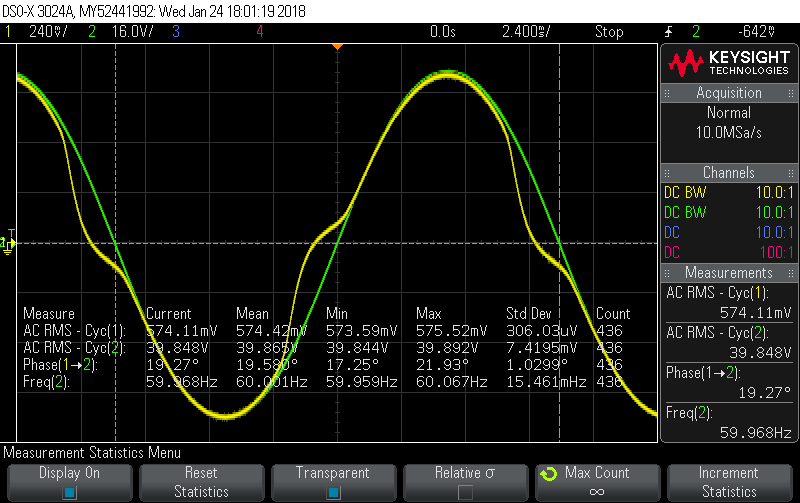
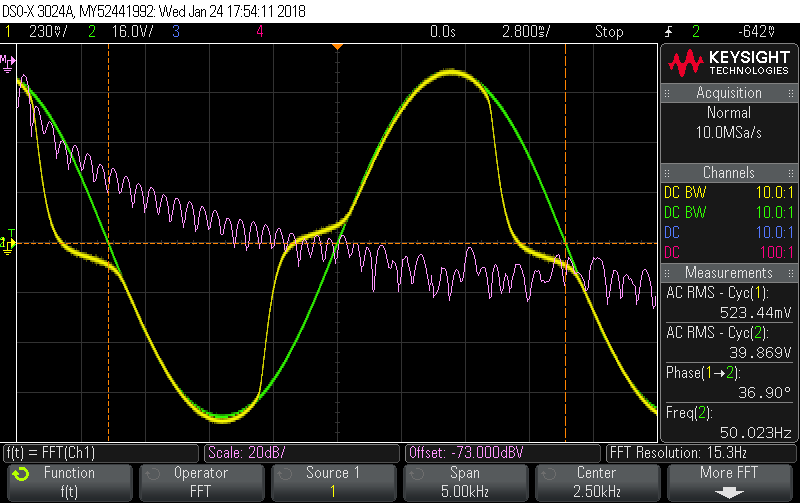
Calibrator set to 20A, 60Hz, 40V, -5.1° phase shift, which gives this picture:


scope_300.csv (87.4 KB)

There’s significant distortion in the current signal, and the voltage across the shunt (representing Irms) should nominally be 600mV but is only managing 574mV … the equivalent of 19.1A primary instead of the actual 20A. Ignore the Phase measurement (19.58°) as it’s meaningless once the signal distorts, although it does show just how kinked the Yellow signal is.

To really see how distorted the signal is we can look at the FFT of the Yellow channel:


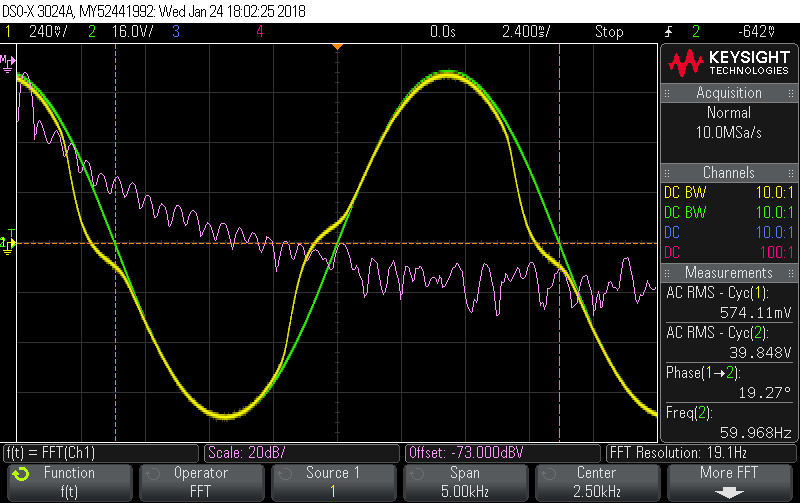
There’s now a significant amount of current in all those odd harmonics and this from a “load” that’s purely resistive with a unity PF.

If you recall the definition of Real Power in the frequency domain, you can immediately see where this is headed:

freqp1

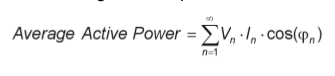
where Vn and In are respectively the voltage and current rms values of the nth harmonics of the line frequency, and φn is the phase difference between the voltage and the current nth harmonics.

All those V’s except for the fundamental (n=1) will be 0, so all those I peaks at the odd harmonics are lost forever with regards contributing to Real Power. All that is a kinda’ complicated way of saying that the impact of that distortion on Real Power is likely to be even greater than it is on Irms (which is out by about 4.5%).

To test that, I extracted the raw data from the scope and did a simple single-cycle power meter with a spreadsheet. For current, I used the nominal calibration (i.e. voltage across the shunt * 20 / 0.6)

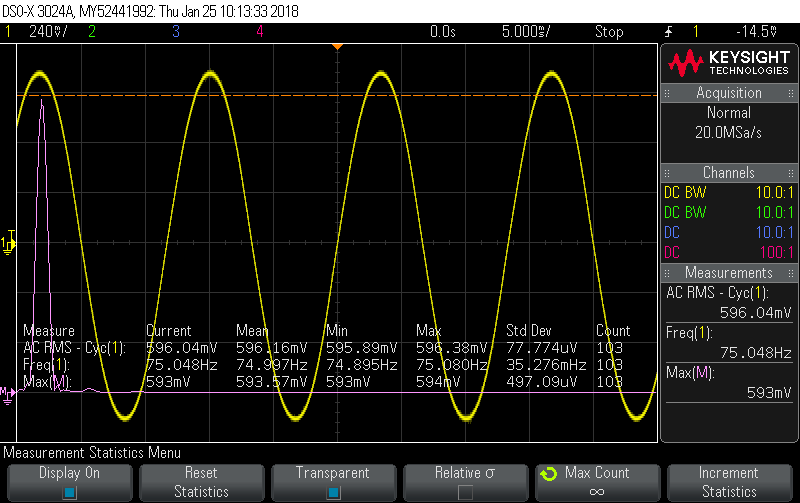
First I used the clean distortion free 10A data to test the “meter”. The first step of that is to plot the data to make sure it’s a good match with what was on the screen:


(use scope_298.csv above to recreate this).
Once again, so clean it’s hard to see the two signals.
The spreasheet single cycle power meter calculated that at:

Vrms: 39.87V (0.3% below nominal)
Irms: 9.94A (0.6% below nominal)
RealPower: 396.2W (1.0% below nominal)
PF: 0.9999

Then I took the distorted data:


(use scope_300.csv above to recreate this).
That one calculated as:

Vrms: 39.87V (0.3% below nominal)
Irms: 19.14A (4.3% below nominal)
RealPower: 749.8W (6.3% below nominal)
PF: 0.9823

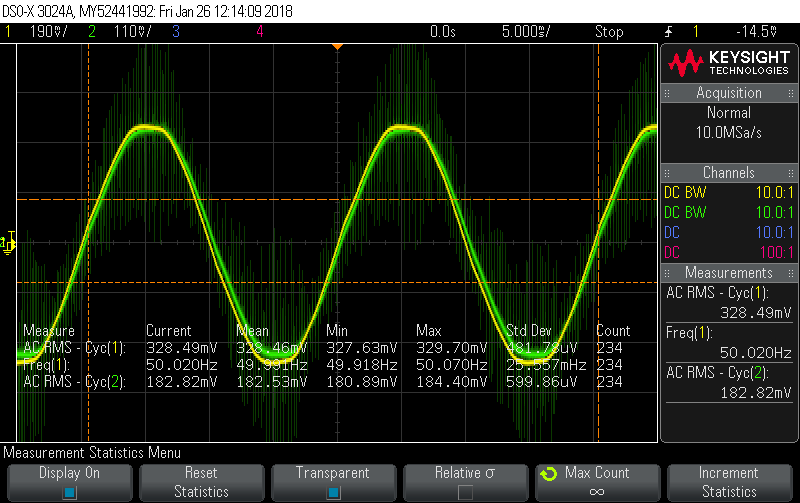
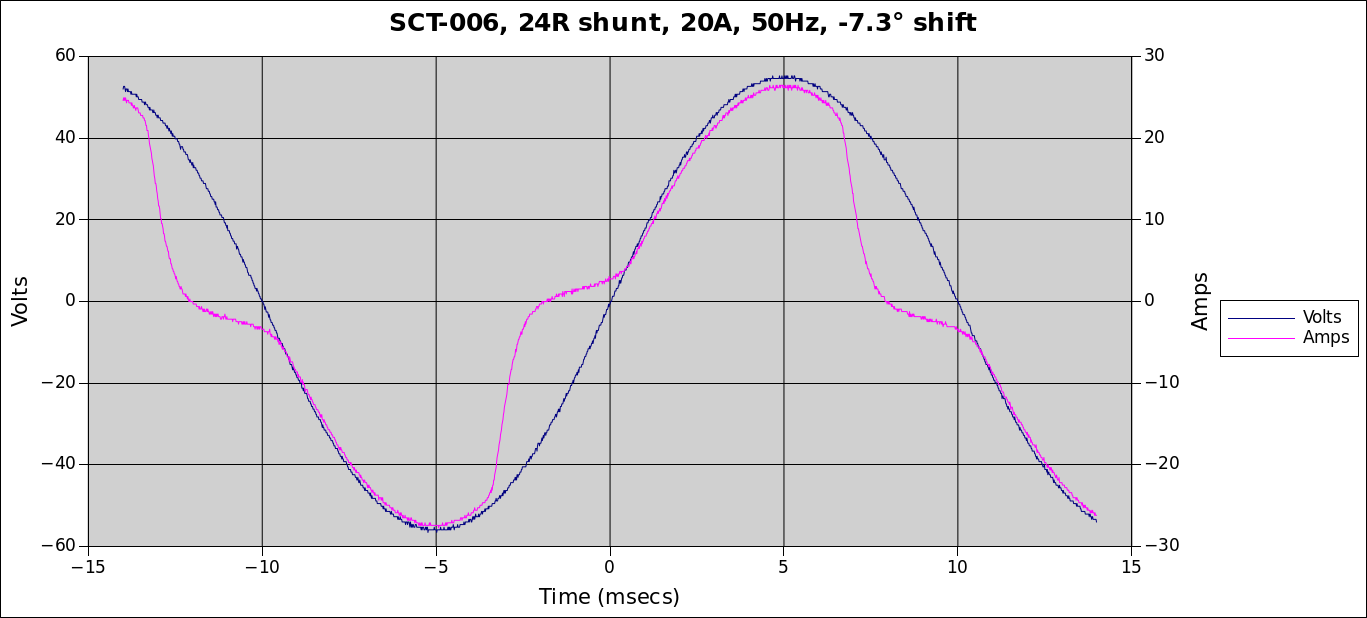
As Robert predicted in the thread referenced above, the data at 50Hz is quite a bit worse. I’ll post that in a follow up reply.

[EDIT] Raw scope .csv files added.

1 Like

Here’s the 50Hz version of all that:

Calibrator set to 10A, 50Hz, 40V, 0° phase shift gives this picture:


Initially the scope reckoned they were out by 6.6° but a second pass called for 7.3°.

Calibrator set to 10A, 50Hz, 40V, -7.3° phase shift gives this picture:


scope_292.csv (87.6 KB)

Again, things are so tight it’s hard to see the Green trace, and the Mean column looks excellent.

Calibrator set to 20A, 50Hz, 40V, -7.3° phase shift gives this picture:


scope_294.csv (87.3 KB)

Big error in the CT voltage (524mV Vs 600mV).

Same setting but with the frequency domain thrown in:


Harmonics up the wazoo.

Testing the spreadsheet “meter” on the good 10A data:


(use scope_292.csv above to recreate this)

Vrms: 39.87V (0.3% below nominal)
Irms: 9.90A (1.0% below nominal)
RealPower: 394.9W (1.3% below nominal)
PF: 0.9999

Running the spreadsheet “meter” on the distorted signal:


(use scope_294.csv above to recreate this)

Vrms: 39.85V (0.4% below nominal)
Irms: 17.46A (12.7% below nominal)
RealPower: 647.5W (19.1% below nominal)
PF: 0.9308

This should be the easiest “load” in the world to measure correctly: purely resistive in-phase 20A load, but that CT distortion is causing the reading to come in 19% low. I think either that shunt value needs to be reduced or you need to stay way back from the 20A limit.

I’ve picked up two more examples of SCT-006s so I’ll test them to make sure it’s not a one-off issue, but a few random spot-checks makes me think the behaviour is pretty uniform.

[EDIT] Raw scope .csv files added.

2 Likes

Excellent (though I confess I understand little of it :smile:). What I do think though, is that this should go into the ‘Learn’ part of the website.

1 Like

The data sheet that I have (http://www.yhdc.us/ENpdf/SCT006-0.01-20A-25mA_en.pdf) is fairly clear, it’s rated to 20 A with a 5 Ω maximum burden. Therefore to use it effectively, it needs to work into a current sink, or an ADC with a p-p input and a reference voltage around 0.36 V.

It kinda’ makes you wonder what market it’s intended for. At first I thought the 333mV (RMS) world but it’s about half that. I thought that had become the industry standard for energy ICs, but maybe they’ve moved on to even lower voltage inputs. With their 24-bit ADCs, they’ve got enough dynamic range to work with this, but it’s needlessly throwing half away.

That was my first thought, and then I did the sums…

I haven’t checked around, but there’s clearly a market somewhere that they’ve aimed at. An op-amp that can feed back 25 mA rms into a virtual earth would work very nicely as a near-zero impedance load, but it will cost a lot of power.

Here’s a plot of measured voltage across the shunt Vs line frequency:

Primary current was 20A throughout so the shunt voltage should be 600mV throughout (25mA through a 24R shunt = 600mV). The Yellow “Expected” plot is actually 597mV, (slightly shy of the 600mV nominal) based on 2x the 10A reading where the CT performs well.

The Blue “Total Vrms” is simply the voltage across the shunt measured in the usual fashion. It’s an indication of how far out any attempt to measure Irms would be using this CT in this manner.

The Pink “Fundamental Vrms” is the voltage across the shunt at the fundamental frequency, i.e. at the line frequency. It’s an indication of how far out any attempt to measure RealPower would be using this CT in this manner. The explanation for that is a bit complicated so I’ll save it for another posting in the hope of keeping the message of this posting clear.

None of this relates to any particular energy monitor, or any nasty distorted load. This is solely about the ability of this CT, fitted with a 24R shunt, to measure a big fat 20A resistive load. There’s nothing any energy monitor can do to recover the original pure sinewave once the CT+24R shunt has distorted it.

1 Like

Great analysis @dBC. Clearly the performance falls away rapidly somewhere between 10 and 20A, any idea where the upper limit of ‘acceptable’ performance is? I am especially interested in 50Hz performance.

One concerning thing here is even with low power circuits like lighting there can still be large startup currents that will temporarily get up into the higher current end, albeit for only a few cycles.

I see your source here is set to 40V. I presume there is no variation in results (being a CT) as this is changed?

So, with a 24 Ω burden would it be fair to assume the ‘upper spec limit’ is more like 20A * (5/24) = 4.16A? With a ‘engineering factor’ of 2 and a bit of headroom this lines up roughly with the 10A performance @dBC has shown.

It’s pretty clean at about 14A, 50Hz (and about 17A, 60Hz) and ramps up fairly gradually from there but by 20A 50Hz it’s pretty much unusable in my opinion… so somewhere between 14A and 20A depending on how discerning you are. I’m blown away by how faithfully it reproduces the primary signal at 10A. That 14A/17A ratio is pretty close to Robert’s predicted 50:60 ratio.

That’s exactly right. That 40V wasn’t connected to anything, well, anything other than a scope channel. I basically needed a pure in-phase sine wave to bang against so I could test how much the distortion would impact the RealPower calculation. I chose 40V because it’s high enough to be clean and noise free but low enough that it wouldn’t hurt too much if I bumped into it.

For the latest Shunt voltage Vs line frequency experiments, I tried a different approach; there was a lot of tedious keyboard/mouse labour in running all those spreadsheet power meter calculations and I didn’t fancy another day of that. I’ll describe the new approach in a reply soon, but didn’t want to clutter the results with the details.

Very interesting results, thanks. I’d say most of the time I’m well below 10 A. Would it be difficult to make a plot of the error vs. current?

That and do-it-all-again with the other two specimens I have were next on my list. Unfortunately, I find myself unexpectedly sans calibrator, so until I get that back I’m not able to contribute more data. If you’re below 10A I don’t think you’ll have any issue with saturation. @Robert.Wall might still be doing his own report on their suitability for use in the emonPi, and judging by the thoroughness of his previous CT reports, there should be plenty of data in there that you can adapt for your usage (I believe there’s a slight difference in shunt values across the various energy monitors… hence the possible need for adaptation).

I still owe a write-up on my “second approach” that I used for the Voltage Vs Line Frequency report. Also, if the forum software permits, I’ll upload the raw csv files from the scope that went into the first two posts in this thread. Often playing around with real data in a spreadsheet can be enlightening on how this stuff works, and it might also act as a form or review. It’s more than possible that I made a mistake in all that copying and pasting, so the more eyes the better.

I have 4 c.t’s to test - 2 100 A ones and two 20 A ones. I’m working on it, but a very preliminary check that I did with one 20 A c.t. showed you’re not far wrong, if at all.

12 A, 22 Ω burden:

16 A, 22 Ω burden:

19.4 A, 22 Ω burden:

Thanks, that last one looks very familiar! I was feeling a bit guilty that I didn’t get around to doing a thorough test of my other two specimens, on the off chance that the one I’m testing is not typical, but your pic there puts my mind at ease.

Slightly less bad than yours, because (a) I’d got my meter in series so couldn’t get the full 5 A (and couldn’t be bothered to put an extra turn inside the core), and (b) my burden was 22 Ω to line up with the emonTx/emonPi, not 24 Ω

Methodology for post 7 (Shunt Voltage Vs Line Frequency).

In the first two posts above, I calculated the impact of the distortion on RealPower by doing the RealPower calculation (across one cycle) and comparing it with the nominal value to be expected if there was no distortion (and ditto for Irms). I referred to that as a spreadsheet power meter. I’ve attached the raw csv files out of the scope so anyone can have a go if they’re so inclined. If you’re not familar with the RealPower calculation, there’s a good description here: Learn | OpenEnergyMonitor

That’s calculating RealPower in the time domain, which as far as I know is how everyone does it. Fetching all that data out of the scope, getting it into the spreadsheet, choosing good cycle boundaries and doing all the maths is a bit like driving across the Nullabor… interesting the first time, but a bit tiresome after that.

For the Shunt Voltage Vs Line Frequency graph I thought I’d try it in the frequency domain and let the scope do all the work… no copying of data or spreadsheets required. If we start at the good end of that graph (75Hz):

The Yellow trace is the voltage across the shunt. Just eyeballing it you can tell it doesn’t look to be distorted at all and its RMS value is 596mV pretty much exactly what we’re expecting. The purple trace is the FFT of the Yellow trace, and the leftmost spike in that tells you how many volts are at the fundamental frequency (75Hz in this case). It comes in at 593.57mV (from the Mean column) and you can see the rest of the purple is very close to a flat line.

Now compare that with the bad end of graph at 45Hz:

You can see the Yellow is extremely distorted, the RMS voltage has dropped down to 481.76mV and the leftmost purple blip is down to 449.09mV (and the purple line is no longer flat-line but rather has a whole bunch of bumps at each of the odd harmonics).

If you go back to that fancy formula for calculating RealPower in the frequency domain:
freqp1

To the extent that your Voltage signal is a pure sinewave it’s really only the first term in that summation (n=1, aka the fundamental frequency, 45Hz) that matters. I1 is whatever current 449.09mV across the shunt represents (~15A), Choose whatever V you like (I chose 40V in the time domain stuff), it’ll pretty much all be in V1 (especially if it’s being generated by a calibrator like my 40V was). Those continued blips in the purple signal correspond to I3 (135Hz), I5 (225Hz) etc and are clearly not zero but their corresponding V3, V5 etc. are (or are close).

So RealPower ends up being pretty close to:

V1 * I1 * cos φ1

cos φ1 is completely unknown, but best case (i.e. highest RealPower) let’s assume V and I are in phase at the fundamental even after the CT induced distortion. So now RealPower is just

V1 * I1 * 1

i.e. V * 15,

So we started with a 20A pure in-phase sine wave for current. RealPower should be
V * 20 but instead reads as V * 15 due to the extreme distortion at 45Hz.

The real proof of this frequency domain approach is to compare it with the time domain approach used in the first two posts. The time domain spreadsheet power meter measured a 6.3% under-read for RealPower at 60Hz due to distortion. The frequency domain approach reckons 7.5%. At 50Hz, the time domain spreadsheet power meter measured a 19.1% under-read for RealPower while the frequency domain approach reckons 18.2%. Given the vastly different approaches taken, and the numerous assumptions made, I think that’s pretty close.

1 Like

Thats great info. My plan was to use a couple of these on low power lighting circuits (with LED lights) so shouldn’t get above 10A except for perhaps a few cycles here and there with transients. Should easily be accurate enough to not be the weak-link in the measurement chain.

Yes, I doubt you’ll have any saturation issues in that usage. I only rigorously tested 10A and 20A at 50Hz and 60Hz and even those 4 datasets was a fair amount of effort. Then I moved on to the frequency sweep from 45Hz to 75Hz to demonstrate how sensitive CTs are to line frequency (and took a frequency domain shortcut there to reduce the labour).

At one stage, while planning how to do the current sweep I briefly eyeballed 14A/50Hz and 17A/60Hz and they looked pretty clean to the naked eye, so I was thinking they might make a good starting point for the sweep up 20A/50Hz and 20A/60Hz. While, psyching myself up for that laborious task of potentially 11 datasets, I lost the calibrator… a blessing in some ways ;-).

I concur. If you can afford to lower the burden resistance (and find a satisfactory balance between gain in fidelity against the loss of ADC resolution), then you should be good to around 16 A at 50 Hz. I haven’t run proper saturation tests yet, that’s only based on a quick test to get the feel of the measurements that I need to make. One of the key measurements will be what is the value of burden that will give you “acceptable” performance at the rated current - is it really only 5 Ω as the data sheet says? (And the question then turns to deciding what “acceptable” is.) And the other is what is the maximum current when working into our standard burden, and does that give “acceptable” performance?

At 10 A, you’ll only be working at 25% of full scale for the emonTx/emonPi, so you’ve effectively got an 8 bit ADC instead of 10.

I realised there was one more test I could do in support for or against your specimen theory, even without the calibrator. Using the grid, heaters and multiple wire wraps like everyone else does, I knocked up a quick-n-easy test of my two SCT-006s sourced directly from China.

I used one of my trusty 20A/333mV CTs as a convenient reference. These go up to 70A before they start to distort but their low voltage output doesn’t make the suitable for OEM kit. Two CTs on the one piece of wire is a great way to make sure everyone is measuring the same signal at the same time.

I used the exact same 24R shunt I used in the earlier experiment on the shop supplied SCT-006 … not just the same value shunt but the same actual shunt.

First a relatively low current to test how well the SCT-006 agreed with the 333mV CT:


Green is the 333mV CT and it measures it at 182.53/333x20 = 10.96A
Yellow is the SCT-006 and it measures it at 328.46/600x20 = 10.95A

A pretty impressive match given it’s all just based on nominal values.

Then I amped it up:


Green is the 333mV CT and it measures it at 314.27/333x20 = 18.88A
Yellow is the SCT-006 and it measures it at 505.29/600x20 = 16.84A

Then repeated the last one with my other Chinese sourced SCT-006 (grid voltage had varied since the earlier reading):


Green is the 333mV CT and it measures it at 315.24/333x20 = 18.93A
Yellow is the second SCT-006 and it measures it at 496.53/600x20 = 16.55A

So all three of mine display similar distortion (and Robert’s seem to too). And I guess we can safely say that 19A isn’t far enough back from the 20A edge for 50Hz users.

It doesn’t rule out your theory though, just a couple more data points. It could be a batch thing. Does anyone know how to decode the YHDC serial numbers? The first 4 digits look like they could be a yymm code? Mine are:

1706 - both Chinese sourced
1710 - Wales sourced

Finally, while I didn’t get the vice out, I used as much force as I could muster with my thumb to try and close it more firmly while watching the scope, but nothing changed a bit.