Another Enphase Envoy-S integration into a local EmonCMS

Similar to Enphase Envoy integration in Emoncms
and Enphase EnvoyS integration in Emoncms (multiphase) I’ve written my own code to get data out of my Envoy-S and into EmonCMS.

The main difference is that I’m using a “hidden” URL that requires the installer password which provides a constant stream of readings via a text/event-stream after a single “Get” request.
The Envoy-S provides the following event containing a json object about every second (I’ve included comments in the first entry below to line up with the json available in more well known URLs on the Envoy):

data: {
    "production": {
        "ph-a": {
            "p": 54.745, // wNow
            "q": 155.094, // reactPower
            "s": 185.367, // apprntPwr
            "v": 246.186, // rmsVoltage
            "i": 0.752, // rmsCurrent
            "pf": 0.31, // pwrFactor
            "f": 50.0 // frequency
        },
        "ph-b": {
            "p": 49.576,
            "q": 139.221,
            "s": 179.72,
            "v": 248.261,
            "i": 0.723,
            "pf": 0.28,
            "f": 50.0
        },
        "ph-c": {
            "p": 42.27,
            "q": 119.811,
            "s": 131.106,
            "v": 245.835,
            "i": 0.532,
            "pf": 0.33,
            "f": 50.0
        }
    },
    "net-consumption": {
        "ph-a": {
            "p": 1184.274,
            "q": 247.115,
            "s": 1220.902,
            "v": 246.192,
            "i": 4.958,
            "pf": 0.97,
            "f": 50.0
        },
        "ph-b": {
            "p": 529.541,
            "q": -331.655,
            "s": 655.161,
            "v": 248.442,
            "i": 2.644,
            "pf": 0.81,
            "f": 50.0
        },
        "ph-c": {
            "p": 331.505,
            "q": -159.651,
            "s": 387.287,
            "v": 245.998,
            "i": 1.575,
            "pf": 0.87,
            "f": 50.0
        }
    },
    "total-consumption": {
        "ph-a": {
            "p": 1239.019,
            "q": 92.021,
            "s": 1405.839,
            "v": 246.189,
            "i": 5.71,
            "pf": 0.88,
            "f": 50.0
        },
        "ph-b": {
            "p": 579.117,
            "q": -470.876,
            "s": 836.026,
            "v": 248.352,
            "i": 3.366,
            "pf": 0.69,
            "f": 50.0
        },
        "ph-c": {
            "p": 373.775,
            "q": -279.463,
            "s": 518.086,
            "v": 245.916,
            "i": 2.107,
            "pf": 0.72,
            "f": 50.0
        }
    }
}

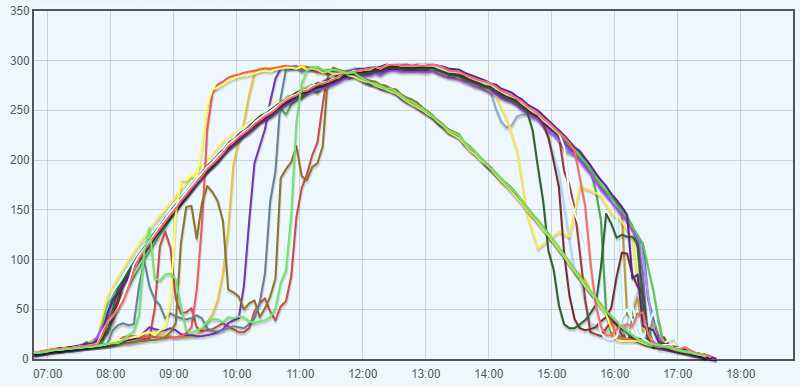
For completeness, ph-a, ph-b and ph-c are my 3 phases and that snapshot was taken late in the afternoon as the sun was going down.
I take the production (ignoring anything below 5W per phase) and then subtract the consumption to produce the nett, basically ignoring the net-consumption provided by the Envoy-S as it’s always “wrong” once the Inverters shut down at night and my OCD doesn’t like seeing a non-zero production number at night.

The specific URL I’m using is http://envoy.local/stream/meter but as I mentioned above. it requires digest authentication and the installer username and password.

Thankfully, someone else has already done the work to allow you to get the installer password for your particular Envoy-S as long as you have the serial number. That same blog is also a great source of information on the available URLs on the Envoy-S.

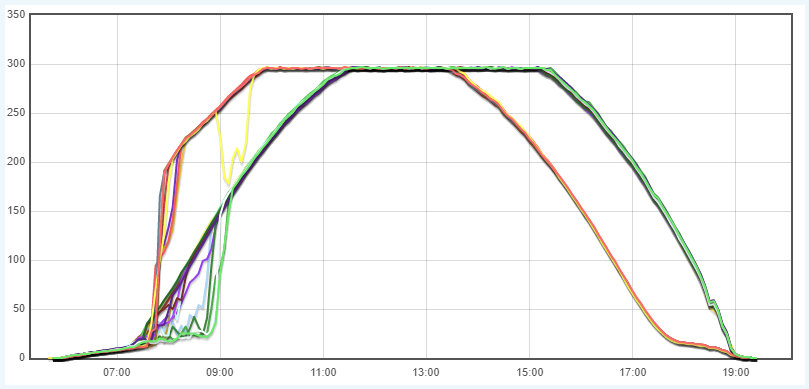
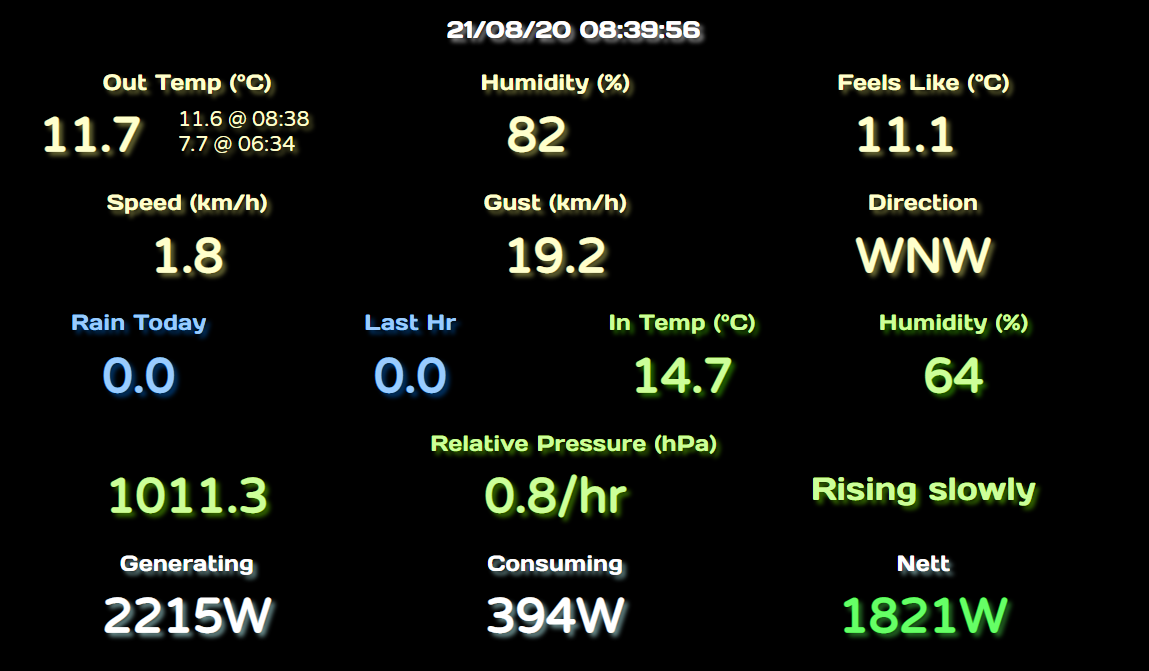
I’m also using this same stream to provide real-time updates (well, about every second) on my home-brew weather station display which runs on an old iPad 1.

The EmonCMS importer is written in Python 3 and runs as a service on my EmonSD based Pi.
The real-time display uses html for the page itself and PHP on the Pi that hosts WeeWX for the eventstream. I couldn’t use javascript on the page to read the eventstream directly from the Envoy because it gets blocked by CORS rules in every modern browser, so I proxy the request via PHP on the Pi.

That Weather dashboard should work against any WeeWx based weather station as it just uses the cumulus realtime plug-in. I should also mention that it uses some modern HTML rendering techniques, but others that would work better are NOT used because they simply don’t work in iOS 5.1.1 which is the latest available on an old iPad 1 :slight_smile:

If there’s any interest, I’ll tidy up the code used for these and post it here.

3 Likes

Thanks for sharing @Greebo thats great!

Interesting to read about the ability to read in a stream of data, I can see that being really useful

We’ve had a perfectly sunny winters day here down under today and the logging to EmonCMS clearly shows the effect of shade from neighbouring trees throughout the day on the individual panels:

Each line is 5 minute average power generation (W) per panel.

There’s 24 panels in total, 8 facing northeast and 16 facing northwest. I’m hoping the shading goes away as the sun gets higher in the sky! Bring on summer.

2 Likes

Ooo nice! :slight_smile:

This does look really nice! I would be interested in seeing the code.

(Also in Australia - Canberra weather has been a bit more overcast than normal, although that may be just because I am wanting to see a nice curve out of the panels :slight_smile:)

Cheers,
Brian

I too would be interested in the code.
I’m using /api/v1/production/inverters at the moment that only updates every 15 minutes.

Thanks,
John
(Central Coast, NSW, Australia)

I’ve got two services, one that reads the stream providing constant data to my local EmonCMS and the other that polls the individual inverter data and loads that into EmonCMS if it ever changes.

This post will be for the stream reader

Data is pushed to EmonCMS approximately every second. In my EmonCMS, I log these INPUTS into PHPFINA FEEDS with a 10 second interval, effectively storing the most recent value every 10 seconds. This is mainly because I’m using the same feeds I was previously using from an EmonTx running the 3-phase sketch and they were already set to a 10 second interval.

The logging expects /var/log/envoy2emon to exist and be owned by the user specified in the service file below, in my case that is pi. You can set up the logging directory with:

sudo mkdir /var/log/envoy2emon
sudo chown pi /var/log/envoy2emon

This is the executable file, mine is called envoy2mon.py and I have it in /home/pi

#!/usr/bin/env python3

import datetime
import logging
import logging.handlers
import signal
import sys
import json
import requests
import time

emonCmsJson  = { }

LogFile           = "/var/log/envoy2emon/envoy2emon.log"

emon_privateKey   = '<EmonCMS Write Key>' # Enter writeApikey here
emon_node         = 'Envoy-S' # Enter Node id
emon_url          = 'http://emon-pi.local/emoncms/input/post?'

envoy_url_stream  = 'http://envoy.local/stream/meter'
envoy_user        = 'installer'
envoy_passwd      = '<Installer password>' # You need this from the Installer Toolkit

def handle_sigterm(sig, frame):
  print("Got Termination signal, exiting")
  logging.info("Got Termination signal, exiting")
  sys.exit(0)

# Setup the signal handler to gracefully exit
signal.signal(signal.SIGTERM, handle_sigterm)
signal.signal(signal.SIGINT, handle_sigterm)

log_handler = logging.handlers.WatchedFileHandler(LogFile)
formatter = logging.Formatter('%(asctime)s PID(%(process)d) %(levelname)s: %(message)s')
formatter.converter = time.gmtime  # if you want UTC time
log_handler.setFormatter(formatter)
logger = logging.getLogger()
logger.addHandler(log_handler)
logger.setLevel(logging.INFO) # Change this for more/less logging
logging.info("****** Starting envoy2emon.py ******")

# Add/Remove entries as required.
# These are the sections of the returned stream that will be sent to EmonCMS.
emondata_keys = {'prod': 'production', 'cons': 'total-consumption', 'net': 'net-consumption'}

# These keys map the name to be sent to EmonCMS against the name returned by the Envoy-S
envoy_keys = {'wNow': 'p', 'rmsVoltage': 'v','rmsCurrent': 'i', 'pwrFactor': 'pf'}

# Each value specified by envoy_keys will be extracted from each section specified in emondata_keys and
# sent to EmonCMS with a name consisting of the combined keys, joined with '_'.
# e.g.
# emondata_keys = {'prod': 'production', 'cons': 'total-consumption'}
# envoy_keys = {'wNow': 'p', 'rmsVoltage': 'v'}
# Will cause to following Envoy values to be sent to EmonCMS:
# Envoy-S JSON name : value -> EmonCMS Input Name = Value
# {production: {p: <pValue>} } -> prod_wNow = <pValue>
# {production: {v: <vValue>} } -> prod_rmsVoltage = <vValue>
# {total-consumption: {p: <pValue>} } -> cons_wNow = <pValue>
# {total-consumption: {v: <vValue>} } -> cons_rmsVoltage = <vValue>

def connectStream():
  try:
    # open the streaming meter data in a requests response object
    r = requests.get(envoy_url_stream, auth=requests.auth.HTTPDigestAuth(envoy_user,envoy_passwd), stream=True)
    if r.status_code != 200:
      print('HTTP response code is [' + str(r.status_code) + ']')
      logging.warning('HTTP response code is [' + str(r.status_code) + ']')
    else:
      logging.info('Stream connection established')

  except ValueError as err:
    logging.error('Caught http exception: ' + str(err))
    r.close()
    return

  # Loop through the data until we get stopped!
  for data in r.iter_lines():
    if data:
      try:
        logging.debug(data);
        meterData = json.loads(data.decode().replace('data: ','',1))
        # Process the json data
        # Production
        for emonK in emondata_keys.keys():
          for envoyK in envoy_keys.keys():
            for phase in  meterData[emondata_keys[emonK]].keys():
              emonCmsJson[emonK + '_' + phase + '_' + envoyK] = \
              meterData[emondata_keys[emonK]][phase][envoy_keys[envoyK]]
      except ValueError as err:
        logging.error('Caught json exception: ' + str(err))
        logging.error('Received data: \'' + data.decode() + '\'')
      else:
        # put anything else that should run normally here
        post_url = emon_url + "&node=" + emon_node + "&apikey=" + emon_privateKey \
        + "&fulljson=" + json.dumps(emonCmsJson, separators=(',', ':'))
        logging.debug(post_url)
        emonR = requests.get(post_url)
        if emonR.status_code != 200:
          logging.info("Response code : " +  str(emonR.status_code))

# Do forever ....
# This will ensure that if the stream is closed for any reason, it will try and re-open it 30 seconds later
while True:
  connectStream()
  time.sleep(30)

The associated systemd service file is also in /home/pi and is named envoy2emon.service.
Instructions for installing it are included in the comments

# Systemd unit file for envoy2emon

# INSTALL:
# sudo ln -s /home/pi/envoy2emon.service /lib/systemd/system

# RUN AT STARTUP
# sudo systemctl daemon-reload
# sudo systemctl enable envoy2emon.service

# START / STOP With:
# sudo systemctl start envoy2emon
# sudo systemctl stop envoy2emon

# VIEW STATUS / LOG
# If Using Syslog:
# systemctl status envoy2emon -n50
# where -nX is the number of log lines to view
# journalctl -f -u envoy2emon

[Unit]
Description=Reads a password protected Envoy-S data stream and sends it to EmonCMS
StartLimitIntervalSec=5

[Service]
Type=idle
ExecStart=/usr/bin/python3 /home/pi/envoy2emon.py
User=pi

# Restart script if stopped
Restart=always
# Wait 30s before restart
RestartSec=30s

# Tag things in the log
# If you want to use the journal instead of the file above, uncomment SyslogIdentifier below
# View with: sudo journalctl -f -u envoy2emon -o cat
SyslogIdentifier=envoy2emon

[Install]
WantedBy=multi-user.target

Feel free to change paths or user as required.

As noted in the first post, this does require the installer password, which is specific to your Envoy-S, but based on your serial number.

1 Like

This post is for the inverter reader

This service polls the inverter URL every 20 seconds, tracking the “last report time” for each inverter. If the “last report time” for an inverter is updated, the updated lastReportWatts and maxReportWatts are posted to EmonCMS. In my Envoy-S, the inverters each update about every 5 minutes.

As above, the logging expects /var/log/envoy2emon to exist and be owned by the user specified in the service file below, in my case that is pi . You can set up the logging directory with:

sudo mkdir /var/log/envoy2emon
sudo chwon pi /var/log/envoy2emon

If you’ve already done that above, there is no need to redo it here.

This is the executable file, mine is called envoy2mon_inv.py and I have it in /home/pi

#!/usr/bin/env python3

import logging
import logging.handlers
import signal
import sys
import json
import requests
import time

emonCmsJson  = { }

LogFile         = "/var/log/envoy2emon/envoy2emon_inv.log"

emon_privateKey = '<EmonCMS write API Key>' # Enter writeApikey here
emon_node       = 'Envoy-S-inverters' # Enter Node id
emon_url        = 'http://emon-pi.local/emoncms/input/post?'

envoy_url       = 'http://envoy.local/api/v1/production/inverters'
envoy_user      = 'envoy'
envoy_passwd    = 'XXXXXX' # Last 6 digits of Envoy-S Serial Number

def handle_sigterm(sig, frame):
  print("Got Termination signal, exiting")
  # Add any cleanup required into here
  logging.info("Got Termination signal, exiting")
  sys.exit(0)

# Setup the signal handler to gracefully exit
signal.signal(signal.SIGTERM, handle_sigterm)
signal.signal(signal.SIGINT, handle_sigterm)

log_handler = logging.handlers.WatchedFileHandler(LogFile)
formatter = logging.Formatter('%(asctime)s PID(%(process)d) %(levelname)s: %(message)s')
formatter.converter = time.gmtime  # if you want UTC time
log_handler.setFormatter(formatter)
logger = logging.getLogger()
logger.addHandler(log_handler)
logger.setLevel(logging.INFO) # Change this for more/less logging
logging.info("****** Starting envoy2emoncms_inv.py ******")

inverterTimes = {}

def ProcessData():
  try:
    # open the inverter data in a requests response object
    r = requests.get(envoy_url, auth=requests.auth.HTTPDigestAuth(envoy_user,envoy_passwd))
    if r.status_code != 200:
      print('HTTP response code is [' + str(r.status_code) + ']')
      logging.warning('HTTP response code is [' + str(r.status_code) + ']')

  except ValueError as err:
    logging.error('Caught http exception: ' + str(err))
    r.close()
    return

  # Loop through the data until we get stopped!
  try:
    inverterData = json.loads(r.content.decode())
    logging.debug(r.content)
    # Process the json data
  except ValueError as err:
    logging.error('Caught json exception: ' + str(err))
    logging.error('Received data: \'' + data.decode() + '\'')
  else:
    for inv in inverterData:
      sn = inv['serialNumber']
      lrt = inv['lastReportDate']
      if sn in inverterTimes:
        if inverterTimes[sn] == lrt:
          # Skip any inverters that still have the same last report time.
          continue
      emonCmsJson.clear()
      inverterTimes[sn] = lrt
      emonCmsJson[sn + '_wNow'] = inv['lastReportWatts']
      emonCmsJson[sn + '_wMax'] = inv['maxReportWatts']
      emonCmsJson['time'] = lrt
      post_url = emon_url + "node=" + emon_node \
      + "&apikey=" + emon_privateKey + "&fulljson=" + json.dumps(emonCmsJson, separators=(',', ':'))
      logging.debug(post_url)
      emonR = requests.get(post_url)
      if emonR.status_code != 200:
        logging.info("EmonCMS submit Response code : " +  str(emonR.status_code))

# Do forever ....
# Will gather Inverter values every 20 seconds until stopped
while True:
  ProcessData()
  time.sleep(20)

Here’s the associated service file for this one. As per the previous post, mine is also in /home/pi and is named envoy2emon_inv.service

# Systemd unit file for envoy2emon

# INSTALL:
# sudo ln -s /home/pi/envoy2emon_inv.service /lib/systemd/system

# RUN AT STARTUP
# sudo systemctl daemon-reload
# sudo systemctl enable envoy2emon_inv.service

# START / STOP With:
# sudo systemctl start envoy2emon_inv
# sudo systemctl stop envoy2emon_inv

# VIEW STATUS / LOG
# If Using Syslog:
# systemctl status envoy2emon_inv -n50
# where -nX is the number of log lines to view
# journalctl -f -u envoy2emon_inv

[Unit]
Description=Reads a password protected Envoy-S data stream and sends it to EmonCMS
StartLimitIntervalSec=5

[Service]
Type=idle
ExecStart=/usr/bin/python3 /home/pi/envoy2emon_inv.py
User=pi

# Restart script if stopped
Restart=always
# Wait 30s before restart
RestartSec=30s

# Tag things in the log
# View with: sudo journalctl -f -u envoy2emon_inv -o cat
SyslogIdentifier=envoy2emon_inv

[Install]
WantedBy=multi-user.target

Once again, feel free to change paths or user as required.

2 Likes

Hi Greebo. Many thanks for sharing.
John.

Finally, here’s the PHP code that provides the event-stream for my “weather dashboard”.
This code provides an event stream back to a browser that looks like:

event: solar_data
data: {"p":6540,"c":4426,"n":-2114}

It only returns the summed “p” value out of the stream because that was all I required. It should be fairly straightforward to add any of the additional properties if required.
You’ll need php-curl installed for it to work (sudo apt-get install php-curl)

This file is named solar_s.php and lives in /var/www/html

<?php
ini_set('display_errors', 1);
header('Content-Type: text/event-stream');
header('Cache-Control: no-cache');
header('X-Accel-Buffering: no');
@ob_end_flush();
set_time_limit(30);

$request_headers = array();
$envoy_url = 'http://envoy.local/stream/meter';
$c = curl_init($envoy_url);
curl_setopt($c, CURLOPT_WRITEFUNCTION, 'proxyStream');
curl_setopt($c, CURLOPT_HTTPAUTH, CURLAUTH_DIGEST);
curl_setopt($c, CURLOPT_USERPWD, "installer:XXXXXXX"); // Replace XXXXXXX with the Installer password

$result = curl_exec($c);
curl_close($c);

function proxyStream($c, $data) {
    $bytes = strlen($data);

    static $buf = '';
    $buf .= $data; // buffer the stream in case we don't get a full event

    // check that we've got a newline signifying a single event
    $pos = strpos($buf, "\n");
    if ($pos === false) {
        return $bytes;
    }

    // only proxy if there is something there
    if (strlen($data) > 50) {
        // remove data: prefix
        $results = str_replace("data:","",$data);
        $array = json_decode($results);
        $production = 0;
        $consumption = 0;
        foreach ($array->production as $phase) {
            $production += $phase->p;
        }
        foreach ($array->{'total-consumption'} as $phase) {
            $consumption += $phase->p;
        }
        if ($production <= 10) {
            $production = 0;
        }
        $net = $consumption - $production;
        $vals = array(
            'p' => (int)$production,
            'c' => (int)$consumption,
            'n' => (int)$net
        );

        $json = json_encode($vals);
        echo "event: solar_data\n";
        echo "data: $json\n\n";
        flush();
    }

    // this is important!
    // won't run if we don't return exact size
    return $bytes;
}
?>

You can make use of it by having a html page with the following html/javascript in it

<body>
    <div class="col col_2-6 sublabel sd">Generating</div>
    <div class="col col_2-6 sublabel sd">Consuming</div>
    <div class="col col_2-6 sublabel sd">Nett</div>
    <div class="col col_2-6 sd"><span class="number"><span id="p"></span>W</span></div>
    <div class="col col_2-6 sd"><span class="number"><span id="c"></span>W</span></div>
    <div class="col col_2-6"><span class="number"><span id="n"></span></span></div>
<script type="text/javascript">
if(typeof(EventSource)!=="undefined") {
    var sSource = new EventSource("solar_s.php");
    sSource.onError = function(e) {
        sSource.close();
        window.location.reload();
    };
    sSource.addEventListener('solar_data', function(e) {
        var current = JSON.parse(e.data);
        if (current.p != "NULL") {
            document.getElementById("p").innerHTML = current.p;
        }
        if (current.c != "NULL") {
            document.getElementById("c").innerHTML = current.c;
        }
        if (current.n != "NULL") {
            if (current.n < 0) {
                document.getElementById("n").className = "generating";
            } else {
                document.getElementById("n").className = "consuming";
            }
            document.getElementById("n").innerHTML = Math.abs(current.n) + "W";
        }
    }, false);
} else {
        document.getElementById("dt").innerHTML="<b>Whoops! Your browser doesn't receive server-sent events.</b>";
}
</script>
</body>

The relevant classes above from the associated css file are:

.col {
    display: block;
    float: left;
    margin: 0.5% 0 0.5% 0;
}
body {
        background-color: #000000;
        font-family: 'Days One', cursive;
        text-shadow: 4px 4px 4px #444;
        color: #FFFFFF;
        text-align: center;
}
.sublabel {
        font-size: 140%;
}
.number {
        font-family: 'Varela Round', sans-serif;
        font-weight: bold;
        font-size: 300%;
}
.col_1-6 {width: 15.33%;}
.col_2-6 {width: 32.26%;}
.col_3-6 {width: 49.2%;}
.col_4-6 {width: 66.13%;}
.col_5-6 {width: 83.06%;}
.col_6-6 {width: 100%;}

.sd {
        color: white;
        text-shadow: 4px 4px 4px #688;
}
.consuming {
        font-family: 'Varela Round', sans-serif;
        font-weight: bold;
        text-shadow: 4px 4px 4px #722;
        color: red;
}

.generating {
        font-family: 'Varela Round', sans-serif;
        font-weight: bold;
        text-shadow: 4px 4px 4px #262;
        color: #6F6;
}

Now that I’ve got access to raw metering data, I thought I’d post an accuracy comparison update.

TL;DR:
Summed over a two month period, the Import value has an error of -3.3kWh out of 637.6 kWh (-0.5%) and the Export value has an error of +7.6 kWh out of 1506.8 kWh (+0.5%)

With my new electricity supplier and the smart meter that needed to be installed for my solar nett metering, I can now download the half hourly meter reading values directly from the supplier up to midnight “yesterday”.

I’ve compared those readings to the values stored in EmonCMS using the above system, for a 2 month period. The EmonCMS data was extracted using the “Graph” module, selecting the time period, specifying 3 decimal places, and an interval of 1800 seconds and then grabbing the “CSV Output” and plugging it into Excel.

The EmonCMS values retrieved are cumulative kWh, which I converted into Interval values in Excel for each half hour interval to match the meter data intervals.

Here’s a small snapshot of the comparison data on one day for a few hours before the sun comes up until midday:
image

When I sum up all of the half-hour values for the 2 month period, it looks like this:
image

Just to recap how this data gets into EmonCMS:

  1. The python script gathers “1 second” consumption and generation data from the Envoy’s server-sent events feed.
  2. The python script pushes those into EmonCMS Inputs using the http Interface (which update every second). Since I have 3 phase; there’s 3 generation and 3 consumption CT’s each of which get sent to EmonCMS as an Input (along with other data as per the python script above).
  3. Calculating an “import only” and “export only” value using Input processing, which I’m storing into PHPFINA feeds configured with a 10 second interval.

Given I’m getting data from 6 individual CT’s, I was very pleasantly surprised with the errors over a two month period!

I’d be very interested if any other Enphase users out there had comparison data for the accuracy of their Envoy CT’s.

Good accuracy.

If you have a pulse LED on the front of the meter, you could use that as an Input for accuracy comparison.

Interestingly (or not) my download from Octopus, when compared to the pulses read using the Agile App on Emoncms, say the pulses reads about 0.3% higher than the Meter data.

I’ve just figured out how to get the same data out of Enlighten (the Enphase Web Interface that tracks usage, generation, import and export) and compared that to the Metering data and my EmonCMS data.
Enlighten gets an update every 15 minutes and I presume that is an average for the interval.

Here’s the comparison for the same period as the post above:
image

Enlighten appears to be way out for both generation and consumption compared to EmonCMS.
The error for both Import and Export for Enlighten was -3.7% (it was -0.5%/+0.5% for the Envoy-S to EmonCMS data)

Remember that the readings are all coming from the exact same Envoy!

Also, just to further clarify, there’s no EmonTx or EmonPi (or any other OpenEnergyMonitor hardware) involved here. My system now consists simply of a RPi 2 running a self install of EmonCMS (using the install scripts), an Enphase Envoy-S (on the same wired LAN as the RPi), and the python scripts in the posts above.

1 Like

The meter pulse sensor can just be connected to a Pi directly if you so desire.

1 Like

You’ll drive yourself mad if you start comparing readings :grinning:

I’ve got four sets of the ‘same’ readings:

  1. The actual meter readings
  2. The data from my Envoy, imported into emoncms
  3. Readings from a CT on the import cable
  4. Readings from an optical reader on the meter
  5. Potentially I can compare the data against Enlighten

They’re all different, even before you begin to account for the independent failure modes they have!

In general, I think the Envoy measures less than the meter, perhaps because of its own self-consumption. CTs being analogue technology have their own errors and each of the digital sources have their own fault modes. I use a fudge factor when I use any of the logged data to replace missed daily readings of the meter and I ignore other discrepancies.

I was actually expecting them all to be different for exactly those reasons, which is why I was so pleasantly surprised to see the “server sent events” feed I’m subscribed to from the Envoy, when fed into EmonCMS in the way I’m doing it, is so close to the results from the billing meter.

Given that I pay for the values from the billing meter, that is my standard of accuracy (whether it is or not is irrelevant), so having real-time values within 0.5% of that is more than I expected.

It was a point of interest more than anything else that Enlighten was so far out :slight_smile:

At some point, I would like to add ‘dynamic’ phase error correction to the emonTx. That should improve the consistency of measurements over a wider range of power factors, currents and voltages. But there are no promises for when that might happen, even if it’s possible.

It has been the first full sun day in a month or more so I thought I’d add another snapshot of the per-panel production graph.

Clearly the sun is high enough that shading has become a non-issue, apart from a single panel for a short period in the morning (the yellow line). The reason for the almost vertical start is the sun has to come up from behind a hill in the mornings, so it is already quite high when it finally hits my roof.


Compared to the graph in August I posted above, it is also clear that the inverters are supplying maximum power for a much greater period of time and I’m keen to see how much wider that will be as we get closer to the solstice.

I’m really loving these solar panels!

1 Like

Interesting. I don’t see that on my system. Does that imply that your inverters are undersized WRT to your solar panels’ maximum output? I’m curious why you would choose to do that?

I see the same “pattern” on my system. With 355 Watt modules driving 250 Watt inverters, the result
looks like this: (3 Sept 2020)


In addition to the widened “peak,” performance on cloudy days has improved significantly.


A “mixture” of 235 and 240 Watt modules driving 215 Watt inverters yielded this harvest on 3 Sep 2019:
Same total number of modules in both instances. (44)


https://enphase.com/sites/default/files/Enphase_White_Paper_Module_Rightsizing.pdf
https://enphase.com/en-us/stories/“over-sizing”-v-“right-sizing”-new-ideas-one-solar’s-oldest-debates

1 Like