Hi,
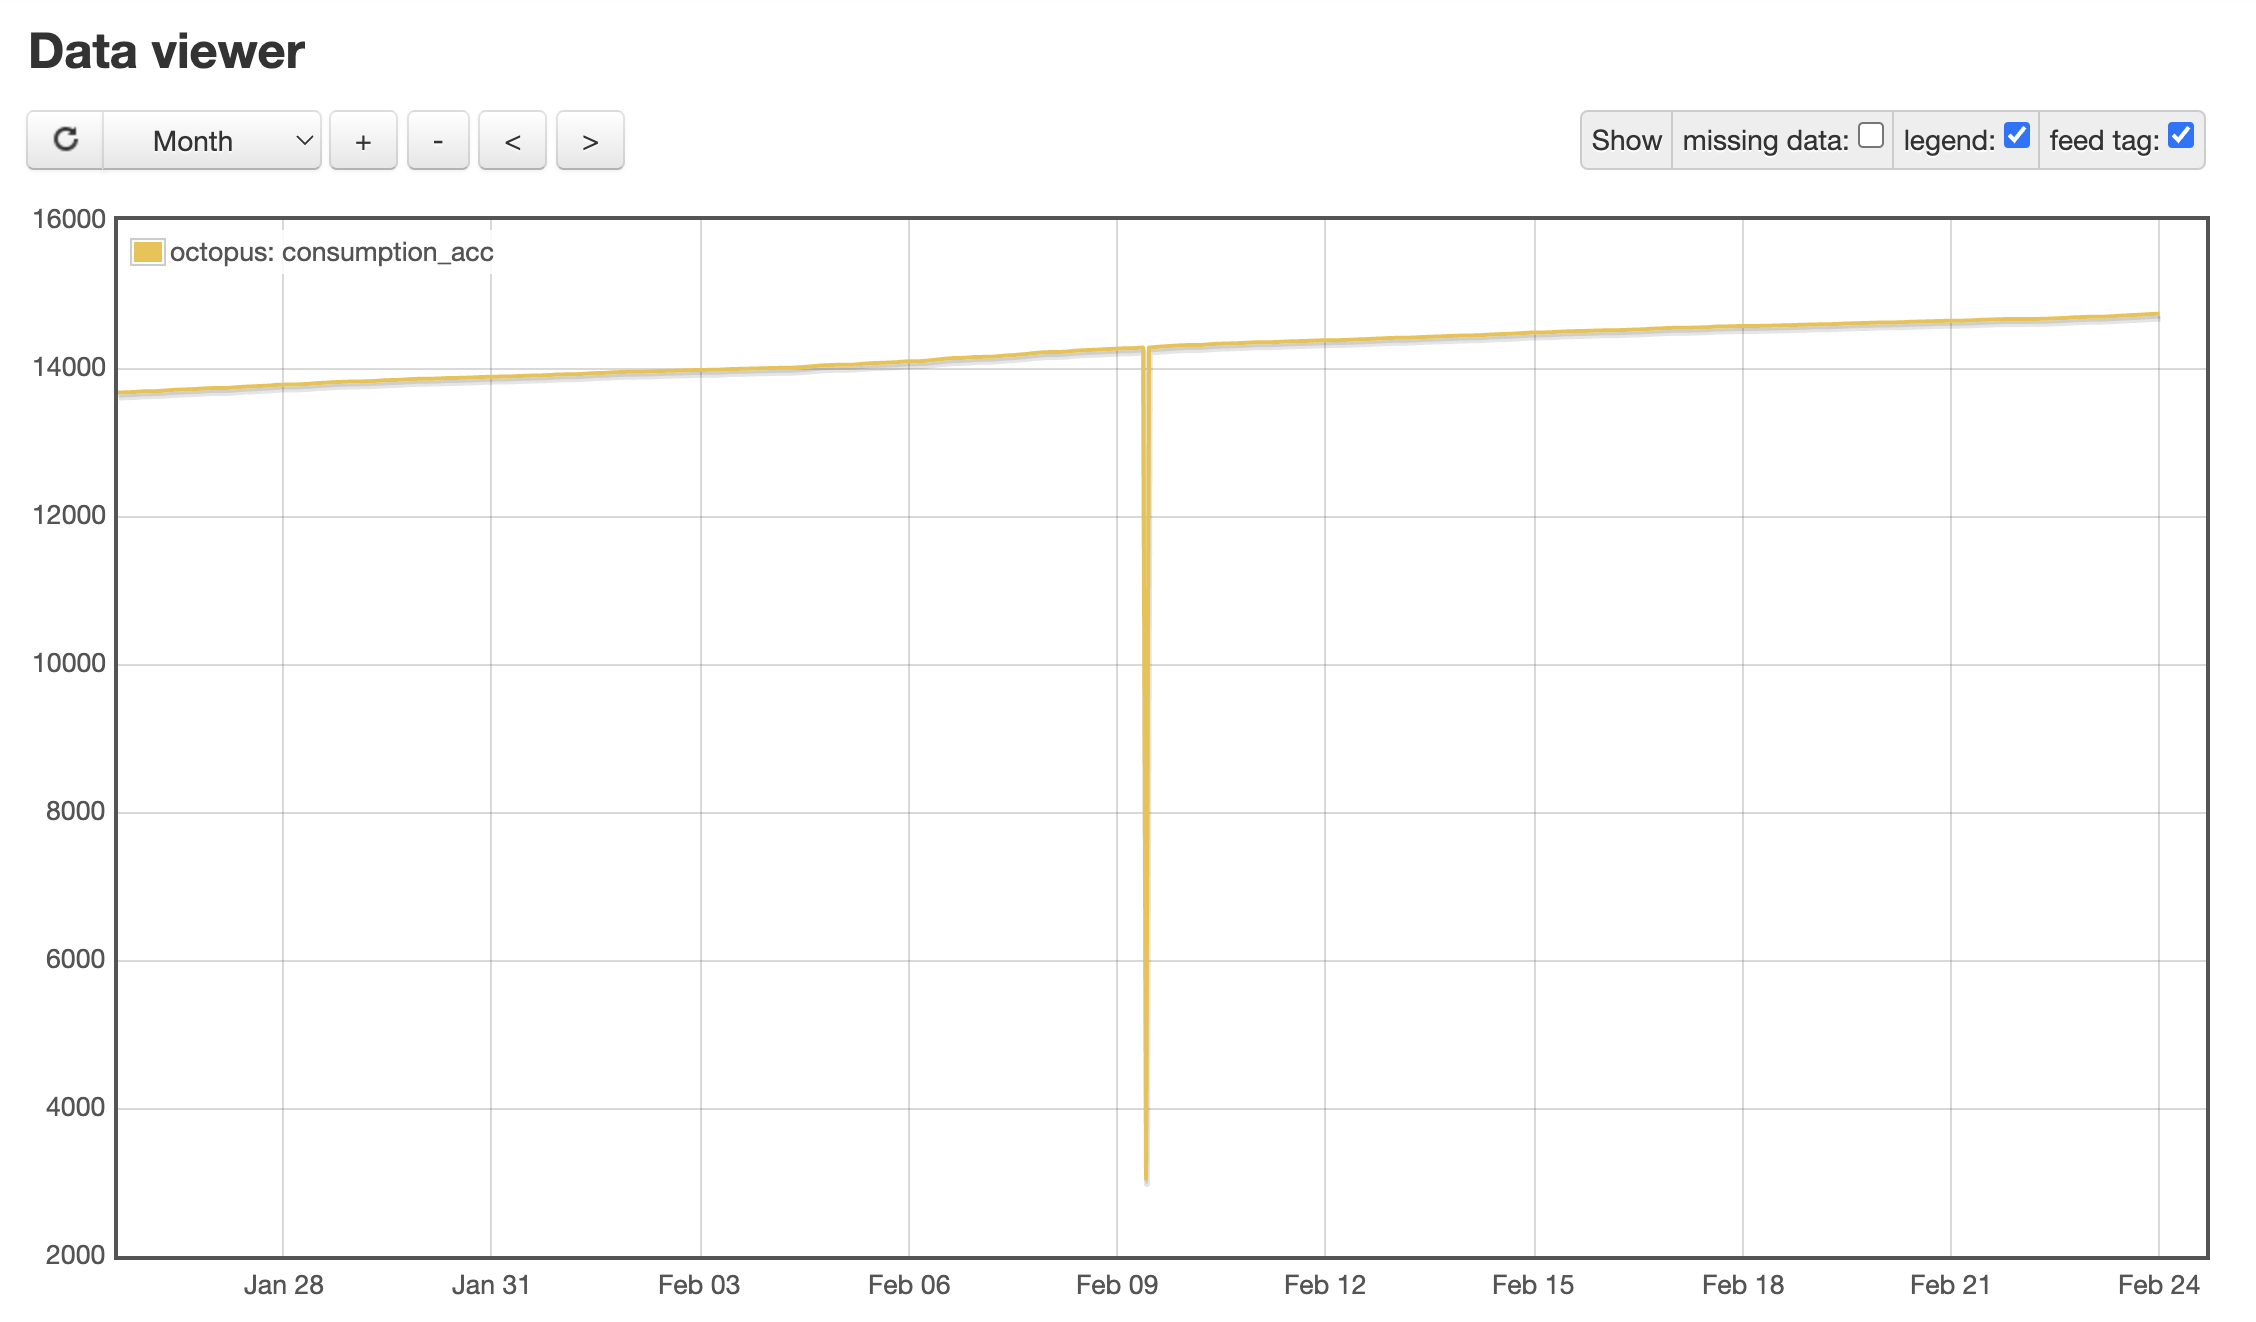
I’m uploading energy data from Octopus but keep getting these random spikes in the accumulator feed:
I’ve got the historic files and have tried re-uploading a couple of time. Sometimes there are random increases sometimes random drops.
Any idea what might be causing this?
Thanks,
Chris
borpin
24 February 2023 15:30
2
Select
@borpin Surely an accumulator should never dip like that?
Where is the accumulator? Is it accumulated data that is being downloaded, or is it hourly (or something) block totals that you are accumulating in emonCMS?
If the data is coming from historic files, what does the source data show at and either side of the time of the spike?
borpin
24 February 2023 20:14
6
No, and don’t call me Shirley
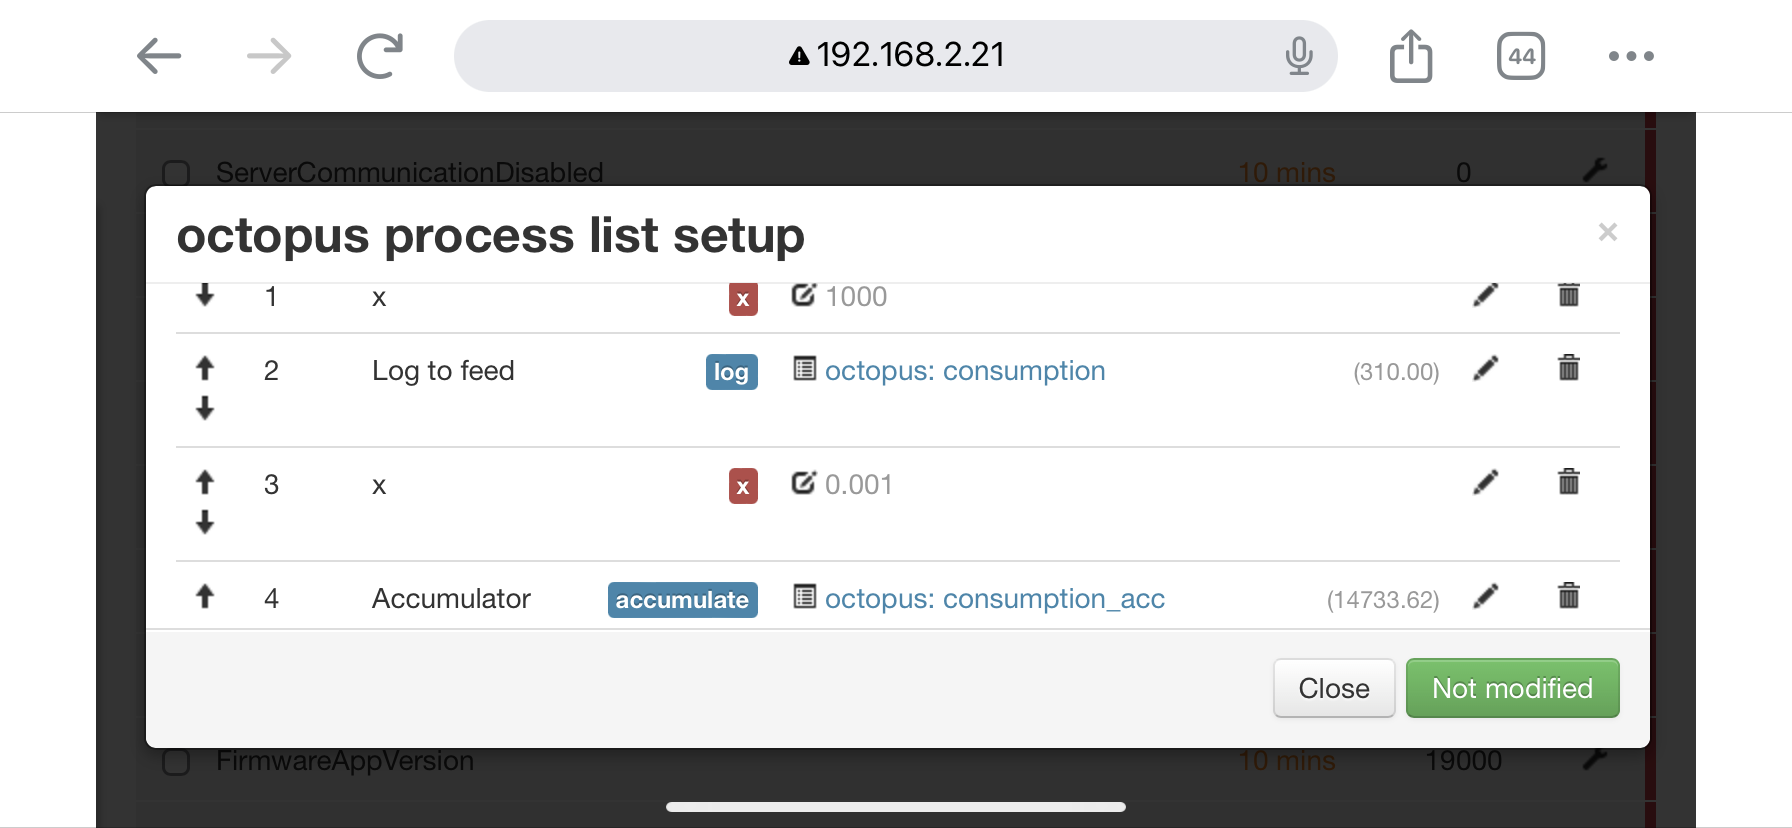
Ok so what is you system setup? select copy markdown in the admin/system page and paste here (no further formatting).
What is the source for the input and what processing are you then doing to create the Feed ?
Server Information
emonhub :- Active Running
emoncms_mqtt :- Active Running
feedwriter :- Active Running - sleep 300s 180 feed points pending write
service-runner :- Active Running
redis-server :- Active Running
mosquitto :- Active Running
emonPiLCD :- Failed loaded failed failed
demandshaper :- Not found or not installed
Version :- low-write 11.2.9
Git :-
Components :- Emoncms Core v11.2.9 | App v2.6.8 | EmonHub Config v2.1.5 | Dashboard v2.3.3 | Device v2.2.2 | Graph v2.2.3 | Network Setup v1.0.2 | WiFi v2.1.1 | Backup v2.3.2 | Postprocess v2.2.7 | Sync v2.1.4 | Usefulscripts v2.3.10 | EmonScripts v1.5.14 | RFM2Pi v1.4.1 | Avrdude-rpi v1.0.1 | Emonhub v2.5.2 | EmonPi v2.9.5
CPU :- 1 Threads(s) | 4 Core(s) | 1 Sockets(s) | Cortex-A72 | 216.00MIPS |
OS :- Linux 5.15.76-v7l+
Host :- emonpi | emonpi | (192.168.2.21)
Date :- 2023-02-24 22:38:36 UTC
Uptime :- 22:38:36 up 15 days, 11:45, 0 users, load average: 0.27, 0.28, 0.27
RAM :- Used: 14.92%
Total :- 1.83 GB
Used :- 279.36 MB
Free :- 1.56 GB
Swap :- Used: 0.00%
Total :- 100 MB
Used :- 0 B
Free :- 100 MB
**** :- - / :- Used: 40.72%
Total :- 5.78 GB
Used :- 2.35 GB
Free :- 3.11 GB
Read Load :- 44.24 B/s
Write Load :- 616.26 B/s
Load Time :- 15 days 7 hours 28 mins
/boot :- Used: 19.52%
Total :- 254.99 MB
Used :- 49.79 MB
Free :- 205.2 MB
Read Load :- 0 B/s
Write Load :- 0 B/s
Load Time :- 15 days 7 hours 28 mins
/var/opt/emoncms :- Used: 0.59%
Total :- 9.61 GB
Used :- 57.96 MB
Free :- 9.06 GB
Read Load :- 5.98 B/s
Write Load :- 233.16 B/s
Load Time :- 15 days 7 hours 28 mins
/var/log :- Used: 30.83%
Total :- 50 MB
Used :- 15.41 MB
Free :- 34.59 MB
Read Load :- n/a
Write Load :- n/a
Load Time :- n/a
Server :- Apache/2.4.54 (Raspbian) HTTP/1.1 CGI/1.1 80
Version :- 10.5.15-MariaDB-0+deb11u1
Host :- 127.0.0.1 (127.0.0.1)
Date :- 2023-02-24 22:38:36 (UTC 00:00)
Stats :- Uptime: 1347671 Threads: 4 Questions: 1293541 Slow queries: 0 Opens: 58 Open tables: 40 Queries per second avg: 0.959
Version :-
Redis Server :- 6.0.16
PHP Redis :- 6.0.0-dev
Host :- localhost:6379
Size :- 554 keys (797.67K)
Uptime :- 15 days
Version :- Mosquitto 2.0.11
Host :- localhost:1883 (127.0.0.1)
Version :- 8.1.12 (Zend Version 4.1.12)
Run user :- User: www-data Group: www-data video Script Owner: pi
Modules :- apache2handler calendar Core ctype curl date dom v20031129exif FFI fileinfo filter ftp gd gettext hash iconv json libxml mbstring mosquitto v0.4.0mysqli mysqlnd vmysqlnd 8.1.12openssl pcre PDO pdo_mysql Phar posix readline redis v6.0.0-devReflection session shmop SimpleXML sockets sodium SPL standard sysvmsg sysvsem sysvshm tokenizer xml xmlreader xmlwriter xsl Zend OPcache zlib
Model :- Raspberry Pi 4 Model B Rev 1.5 - 2GB (Sony UK)
Serial num. :- 1000000070F92BBC
CPU Temperature :- 40.41°C
GPU Temperature :- N/A (to show GPU temp execute this command from the console “sudo usermod -G video www-data” )
emonpiRelease :- emonSD-10Nov22
File-system :- read-write
Client Information
Browser :- Mozilla/5.0 (iPhone; CPU iPhone OS 16_2 like Mac OS X) AppleWebKit/605.1.15 (KHTML, like Gecko) CriOS/110.0.5481.83 Mobile/15E148 Safari/604.1
Language :- en-GB,en;q=0.9
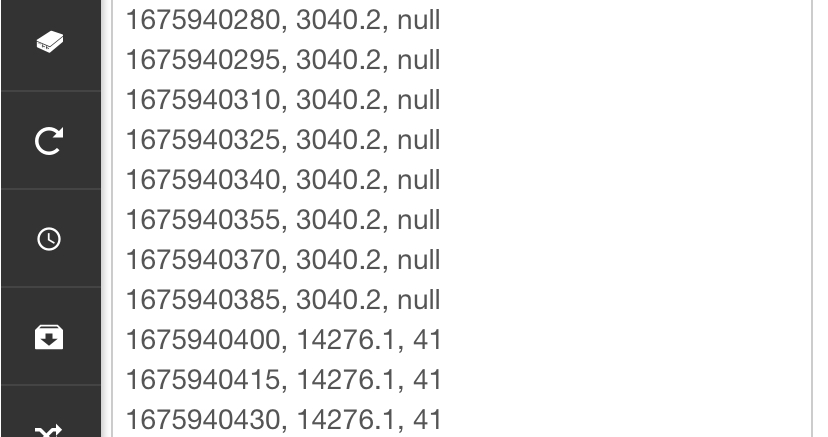
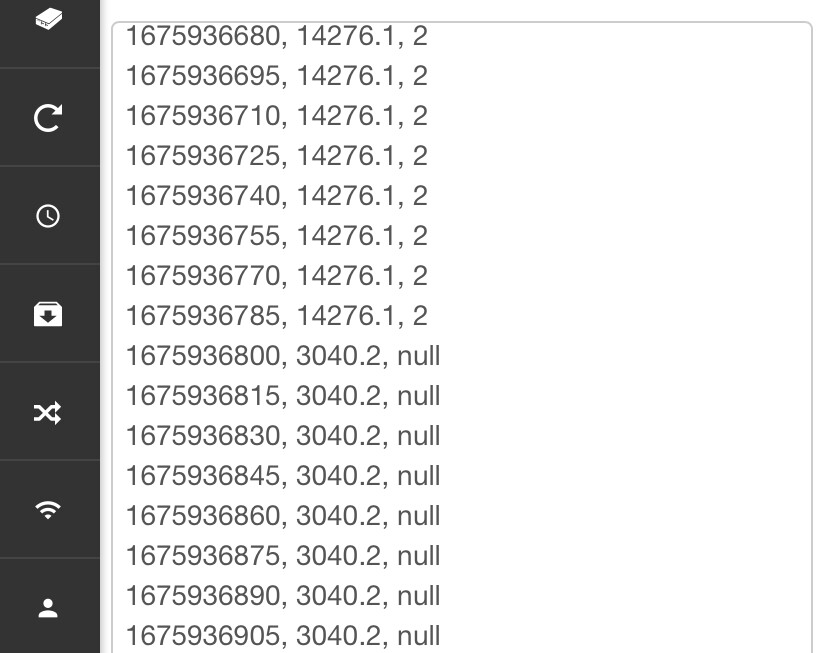
Here’s the CSV data around the time.
It’s not a single wrong value, the wrong values cover at least 90 seconds each (15 s × 8). Is this the historic data? If it is, no amount of reloading will correct it, and the fault either existed in the data at the time it was recorded, or it is a failure of the recording medium.
To get any further, you need to work out the significance of the number 30340.2
I think we might have actually had a power outage that day. What I can’t understand is why the accumulator dropped and then shot back up again. It’s like the nulls are throwing it out.
Since the 3040.2 isn’t raw data, I’m hoping that I can work out how to correct it.
borpin
26 February 2023 09:39
11
There is a PR, but this is a reset to zero not a ‘spike’
emoncms:master ← borpin:bpo-reset-cumulative
opened 06:08PM - 25 Sep 20 UTC
I have seen this happen to me; i.e. the cumulative process resetting to zero.
…
Community discussion
https://community.openenergymonitor.org/t/correcting-cumulative-kwh-reset-with-post-process-module/4631/12
nicsergio suggested a fix to the get_timevalue() function. I have pulled that in here for discussion.
As it relates to one of your comments @chaveiro perhaps you could look at the logic. I am **not** suggesting this is correct just the user reports that the issue stopped for him when using this code.
Another user has noted this happening as well. https://community.openenergymonitor.org/t/how-is-post-processing-supposed-to-work/15478
It’s really strange. I’ll have a play about and see if I can work round it.